County Levers to Drive Economic Mobility: Local Solutions and Strategies

Author

Stacy Nakintu

Kevin Shrawder
Upcoming Events
Related News
Introduction
Counties Advancing Economic Mobility Across Seven Key Issue Areas
County governments play an instrumental role in building the economic resilience and vitality of communities and supporting the economic wellbeing of residents. Community characteristics such as quality housing supply and safe and navigable neighborhoods, services like public health programs, early childhood education and workforce development training for jobseekers, connectivity to the marketplace through technology and information, are all local factors that support the economic mobility of individuals and families. Counties and county leaders are uniquely positioned as changemakers through local authorities and duties to have a direct impact on each of these and more.
Economic mobility is a highly local, connective and relational issue.
In the United States, the concept of economic mobility centers around the ideal that each generation can do better than the last. Local conditions, community characteristics and even power and autonomy can affect opportunities for individuals’ long-term economic success; these aspects can be shaped by local policies.1 That is, economic mobility is a highly local, connective and relational issue.2 Because counties have power and authority to impact factors and conditions that influence long-term economic outcomes and boost upward mobility, county leaders can benefit from a comprehensive understanding of economic mobility and the intersections of related issues.
This report focuses on the underlying elements of economic mobility and identifies how county leaders can use local power and authority to leverage county policy, planning and service delivery as levers to foster upward mobility for residents. This report includes a conceptual overview of economic mobility and a discussion of the roles, responsibilities and authorities of county governments. Also featured in this report are several case studies highlighting the various ways counties are using these levers to develop community-based approaches to promote successful economic outcomes for residents.
The case studies in this report feature members of NACo’s Economic Mobility Leadership Network (EMLN), a cohort of county leaders that examines the range of complex issues that comprise economic mobility, including housing and food insecurity and an overall lack of opportunity.
Jump to Section
Understanding Economic Mobility
ECONOMIC MOBILITY: AT A GLANCE
Economic mobility refers to changes in people’s economic outcomes or status over a lifetime or across generations — usually measured in income. Simply put, economic mobility examines people’s movement up and down the economic ladder over a lifetime. However, economic mobility is a multi-faceted concept. In one regard, economic mobility can be understood as comparing an individual’s income as an adult relative to their parent’s or grandparent’s income (previous generations) — that is, inter-generational mobility. Alternatively, economic mobility can encompass looking at how groups of people, or generations move up and down the economic ladder over time, that is, it examines changes in an individual’s income over their life — also known as intra-generational mobility.
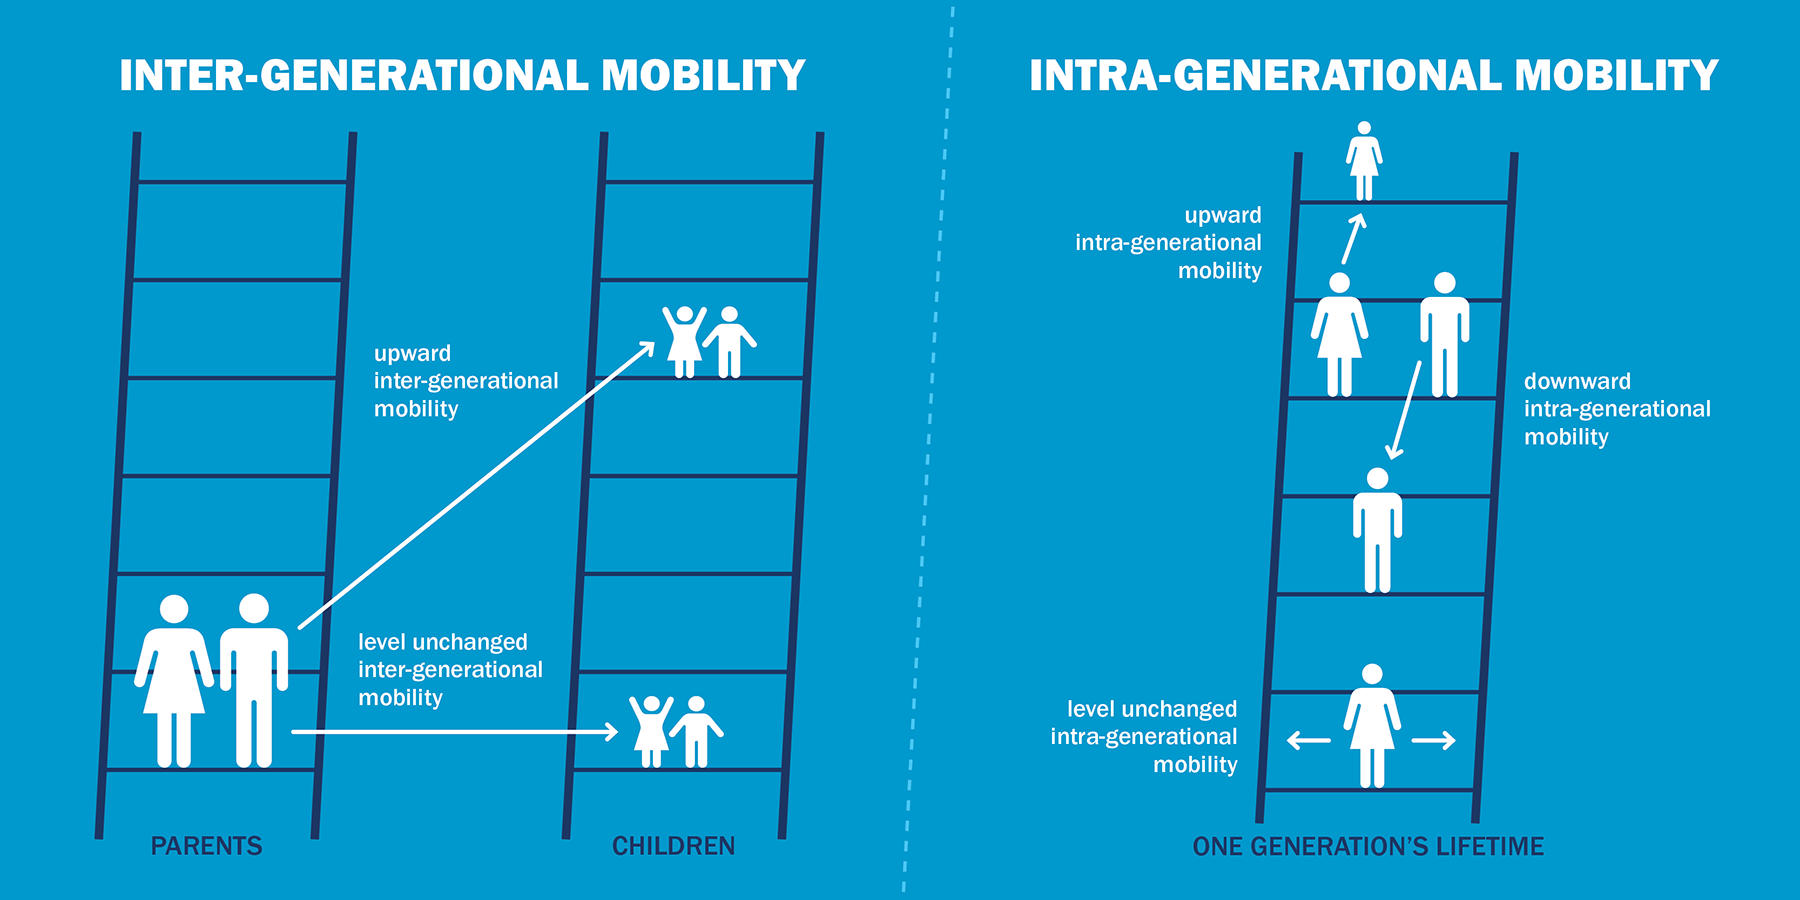
Inter-and intra-generational mobility can be measured based on absolute or relative differences. Absolute mobility examines individuals' upward and downward changes in their income over time that is, absolute mobility evaluates actual financial progress. On the other hand, relative mobility examines how individuals rank in the income distribution (or ladder) over their lifetime and in comparison to their peers (other individuals within a generation) or their parents. For example, an application of this measure includes examining whether the share of individuals born in the bottom fifth (or quintile) of the income ladder remain at the bottom as adults or rank higher in the income distribution. Each of these concepts tells a different story about people's lifetime economic outcomes.
Emerging research outlines the variety of factors (or drivers) that influence economic mobility, such as a parent’s level of income, social or peer connections, neighborhood quality, education, housing and financial security or institutions including family, tax systems and labor markets. While the relationships between economic mobility and these factors point out likeness among areas with similar rates of mobility and should not necessarily be understood as causal effects, the factors stand out as key elements in research and policy discussions.
Simply put, economic mobility examines people’s movement up and down the economic ladder over a lifetime.
Economic Mobility: Key research findings
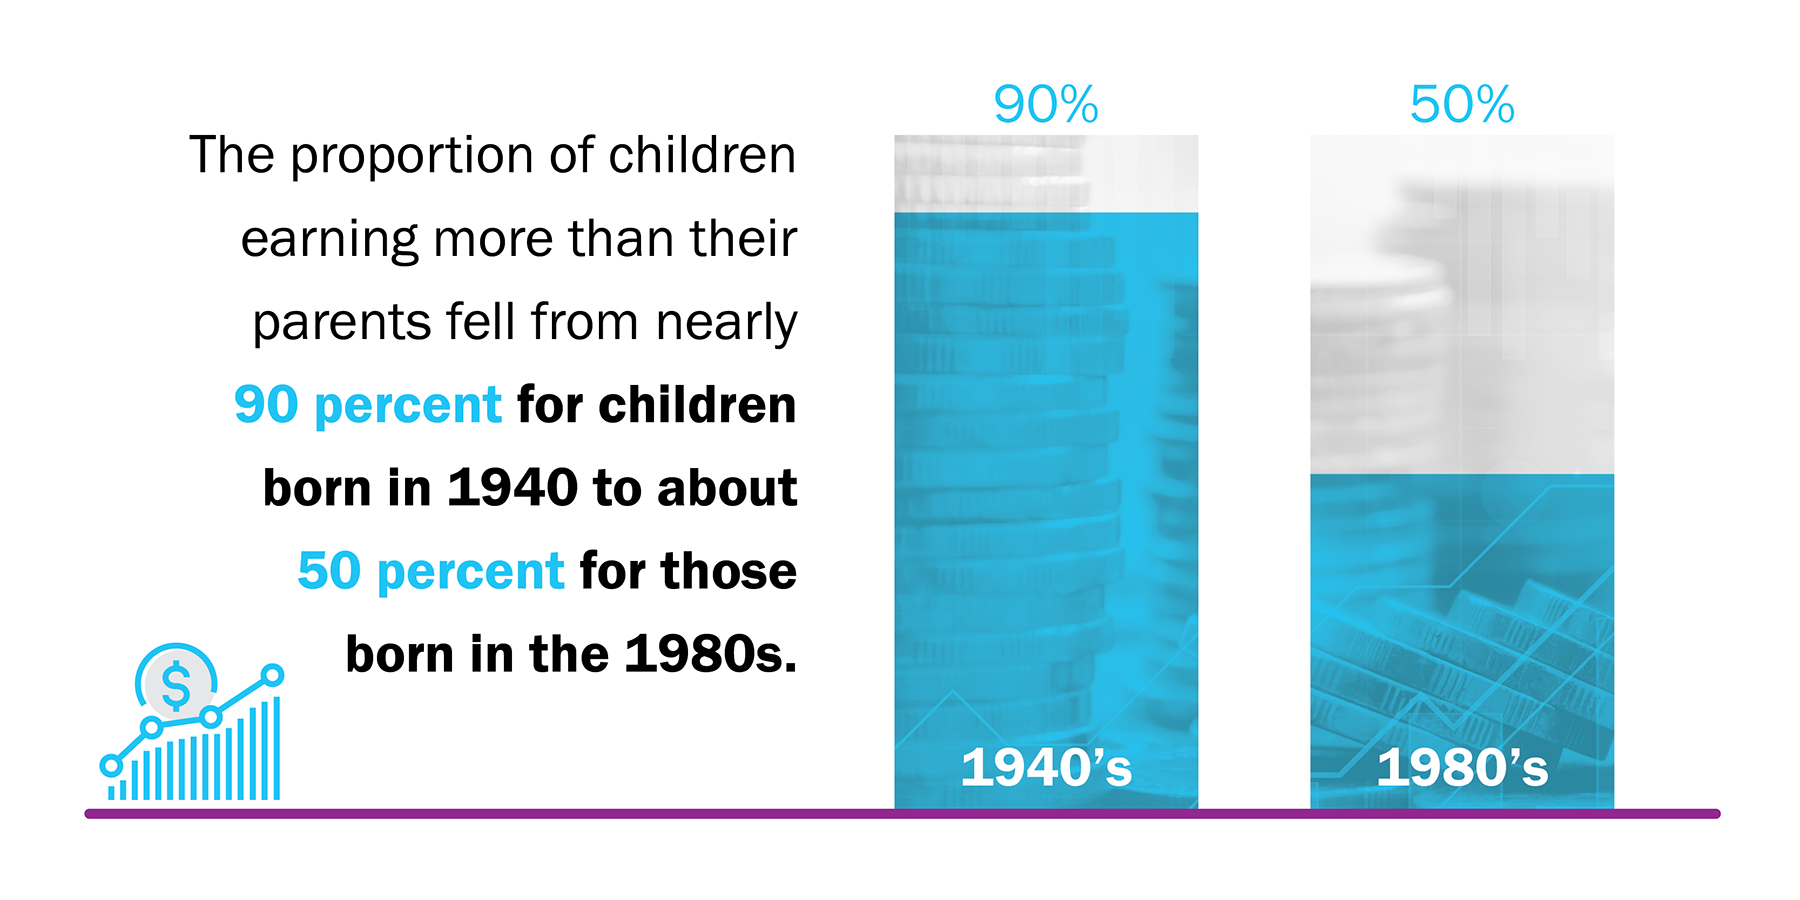
In the United States, absolute mobility has fallen over time while relative mobility has remained constant.5 Over the past half century, absolute mobility fell sharply in the United States. The proportion of children earning more than their parents fell from nearly 90 percent for children born in 1940 to about 50 percent for those born in the 1980s. On the other hand, the gap between the average income percentiles for children born in lower-income versus higher-income families has remained relatively constant, emphasizing the influence of a parent’s income on their child’s income prospect.
- The United States is behind other advanced economies in terms of upward mobility.6 Though there are areas in the United States where relative mobility rates are higher than those in peer countries, the United States overall ranks lower than many other major industrialized economies when it comes to prospects of making it from a childhood in poverty to an adulthood in affluence. That is, children from poor families have a difficult time moving from the bottom to the top of the income ladder.
- Intergenerational mobility varies greatly within the United States.7 For example, at the regional level, children who grew up in the Southeast have lower relative mobility levels compared to children who grew up in the Mountain West and the rural Midwest.9 Similarly, children from families in Charlotte, N.C. at the bottom quintile of the income distribution (low-income families) are 4.4 percent likely to reach the top quintile, in contrast to a 12.9 percent likelihood for children from San Jose, Calif.10 The likelihood of a child moving from the bottom to the top of the income ladder is three times larger for those growing up in San Jose compared to those growing up in Charlotte. The presence of geographical differences in both relative mobility and absolute mobility suggests location shapes mobility.11 Equally important, the similarity in the patterns of geographical differences in both relative mobility and absolute mobility suggests that places with higher relative mobility levels also have better absolute economic outcomes for children from low-income families.12
- A child's neighborhood environment affects their economic future.13 A “good” neighborhood, in the context of upward mobility, is one that produces better outcomes for children. Neighborhoods impact children’s long-term outcomes through childhood exposure effects – that is, for every additional year a child spends growing up in an area with high-upward-mobility (or an area where the permanent resident income is high), the child’s income in adulthood increases accordingly.14 Additionally, if children move to a better neighborhood earlier in their childhood, the effects on their income as adults are larger.
- Racial and ethnic disparities are evident when examining differences in economic mobility rates across generations.15 Despite increased opportunities for communities of color in the United States, there are large and persistent gaps in socioeconomic outcomes (i.e., opportunity, education, income and wealth) across racial and ethnic groups, especially between Black and white communities.16 Black and Indigenous children are less likely to move up the economic ladder and downward mobility – moving down from a position of economic advantage – is much higher among them than other groups.17 Black children from a high-income family are almost as likely to fall to the bottom income group as they are to remain in the top income group.18
Overview: County Role, Authority and Levers in Economic Mobility
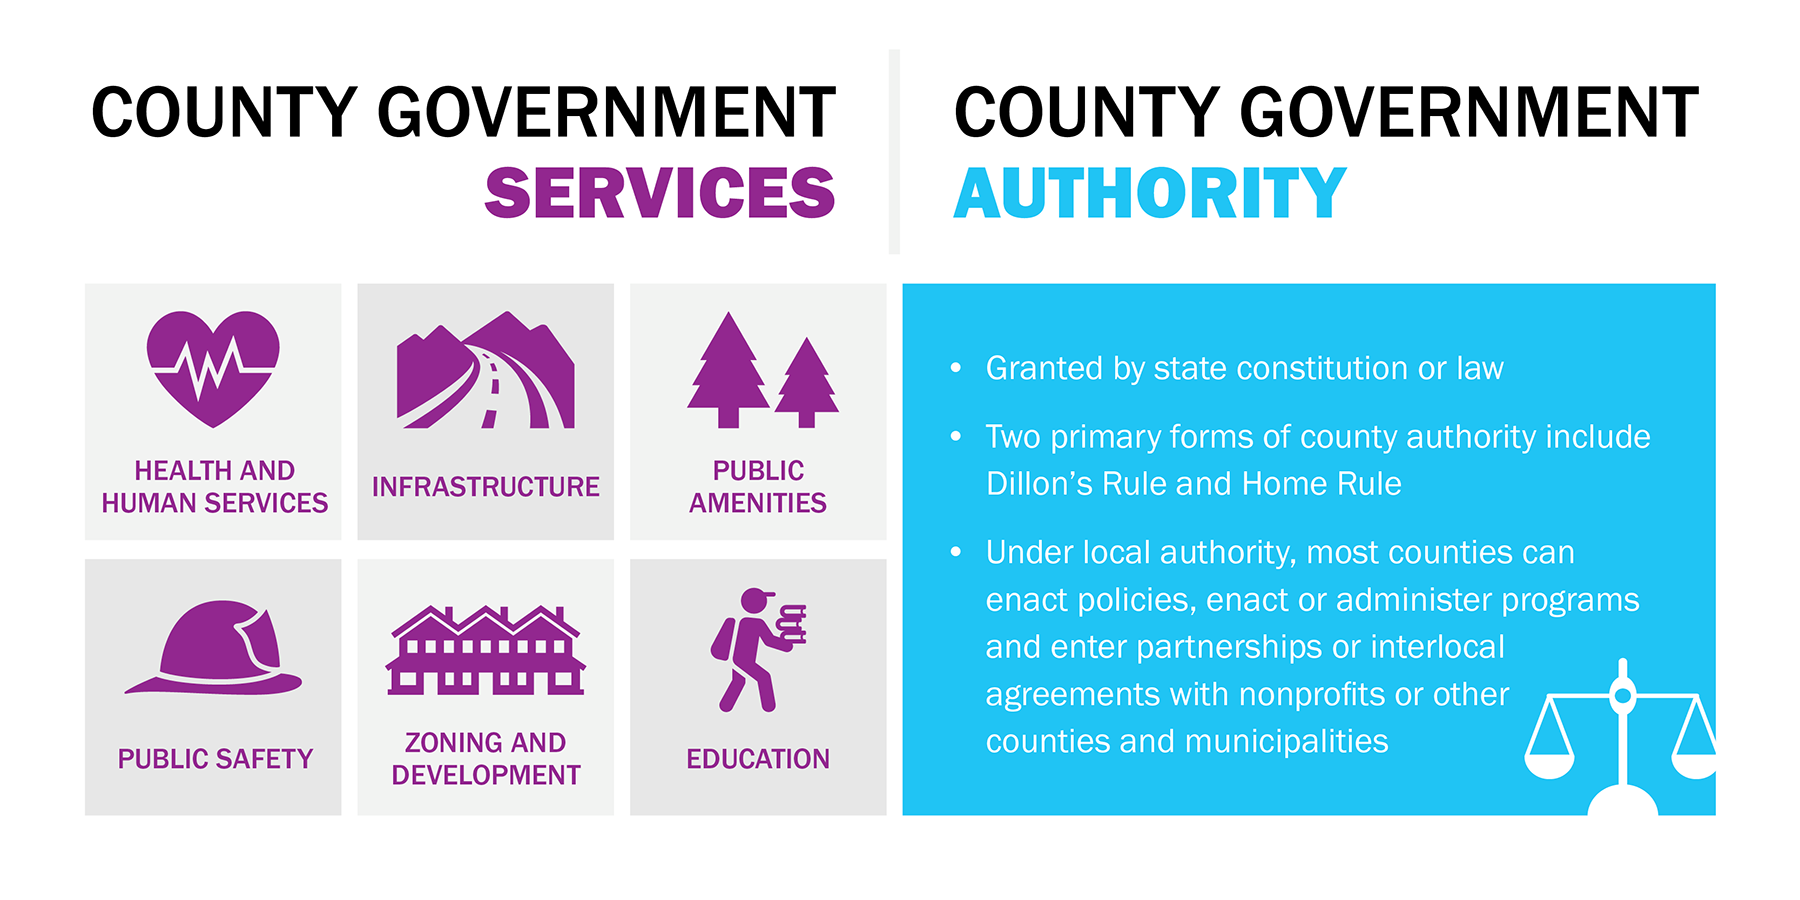
Counties provide essential services to over 300 million residents in communities across the nation while balancing numerous administrative responsibilities. Counties are responsible for operating and maintaining transportation and infrastructure systems, operating local health systems, providing emergency response, coordinating elections and providing core social assistance services from early childhood development to elder care. Counties also coordinate and facilitate a wide range of economic and community development programs, from business incentives and retention to workforce development and community revitalization. Furthermore, counties execute such programs in partnership with nonprofits, the private sector and other interested government entities.
Counties derive authority from the state, which includes the power to create budgets, levy taxes, issue bonds, create public corporations to fund county programs, provide services and perform numerous other tasks related to the operation of the county government. Within the authority granted by the state, most counties can enact policies (e.g., passing ordinances or resolutions), enact or administer programs and enter partnerships or interlocal agreements with nonprofits or other counties and municipalities.
There are two basic types of governing authority for counties: Dillon’s Rule and Home Rule.19 Under Dillon’s Rule, counties only have powers granted to them by the state and can only take actions expressly implied in state legislation including changes to the government structure, function, fiscal organization or passing any law or ordinance not specifically permitted under existing state legislation. On the other hand, under Home Rule, states grant counties or municipalities, through their constitutions or statutes, authority that includes local autonomy or self-determination.20 Thus, Home Rule counties have greater control over local affairs than Dillon’s Rule counties and often govern based on the preferences of residents. Such counties can pass laws to govern themselves as necessary and have more flexibility in altering government structure (such as increasing the size of their legislative body), providing additional services, creating special districts, entering interlocal agreements and adjusting revenues and expenditures.
In the context of economic mobility, levers are tools which county governments can wield to help residents move up the economic ladder. They include broad categories of policy and decision-making powers, enacting or administering programs and forming partnerships. The power to enact change is tied to the county’s authority to perform duties in the structural, functional and fiscal domains of operations. When it comes to economic mobility, county levers can include allocating dollars to fund critical human services programs, policy resolutions or ordinances to meet the needs of underserved communities and populations and forming impactful partnerships to better serve the needs of local communities. Counties can leverage these tools within their authority to help millions of residents move up the economic ladder.
Local leaders operate within varying degrees of authority to enact mobility solutions.

Housing
Housing is the backbone of economic development for communities.
Housing
Housing is the backbone of economic development for communities. Without safe and affordable housing, businesses are less likely to attract workers, hindering the economic well-being of the community. Children who have access to stable and affordable housing have a healthy cognitive development, and families gain access to improved educational opportunities, well-paying jobs, workforce training and resources to improve their financial well-being.21 Counties play a critical role in meeting this crucial need for residents and businesses alike, investing nearly $13 billion annually in housing and community development.22 Counties impact housing supply through community planning, land use, zoning and other regulations. Additionally, counties invest in housing support services for individuals with disabilities, low-income populations, veterans and those experiencing homelessness.
Children who have access to stable and affordable housing have a healthy cognitive development, and families gain access to improved educational opportunities, well-paying jobs, workforce training and resources to improve their financial well-being.
Many residents struggle with housing challenges, spending large portions of their monthly income on housing. In 2019, cost-burdened residents, those that spent more than 30 percent of their income on housing alone, comprised nearly half (46 percent) of renters and over one fifth (21 percent) of homeowners.23 This affordable housing issue inhibits a resident’s ability to accumulate wealth (a key driver that enables families to change their economic status). Low-income residents, as well as Black, Hispanic and American Indian/Alaskan Native households, disproportionately face these housing affordability challenges.24 Furthermore, households of color form a disproportionately large percentage of renters, further illustrating the challenge counties face in ensuring equitable access to affordable housing for all residents.25
Depending on state statute, a county may have different tools available to support housing. Some counties can raise taxes and fees to invest funds into housing, either directly or through a housing trust fund. For counties unable to allocate funding to housing due to either state law or a strict budget, many levers exist in the realm of planning and zoning. More specifically, counties with this authority can include a housing element in their comprehensive plans, conduct housing needs analyses or require affordable housing impact statements from developers. Many counties can also leverage zoning regulations to make housing more affordable, such as reducing lot size requirements or designating areas for medium-density housing or provide incentives – such as density bonuses – for developers to build more affordable units. Other counties may have authority over the permitting and review processes, such as to streamline them or to reduce fees. Finally, counties may have the ability to partner with other local jurisdictions (see Waukesha County, Wis. case study), community organizations or businesses to pool resources, garner residents support and develop regional strategies for addressing housing affordability (see Palm Beach County, Fla. case study).
Spotlight
About the County
- County Authority: Home Rule
- Population (2020): 1.5M
- Size of Labor Force (2020): 717k
- Unemployment Rate (2020): 7.6%
- County Economic Output (2019): $75.6B
- Median Household Income (2019): $63.3k
- Top Three Industries by Economic Output (2019): Professional & Business Services; Real Estate & Rental and Leasing; Educational Services, Health Care & Social Assistance
- Sources: See endnote 26.
Learn More about Palm Beach County
Key Program Tenets
- Cross-county department partnership
- Support and encourage the development of affordable housing units for eligible households
- County match for the statewide Low Income Housing Tax Credits program
Community Impacts
- More than 90 residential development housing projects as of 2021
Within the housing projects, 13 percent of total units are reserved for eligible households
Residents of color comprise the largest share of WHP beneficiaries — that is, 47 percent are Black, and 35 percent are Hispanic
Overview
In October 2019, Palm Beach County, the third-largest county in Florida, launched the Securing Our Future Initiative. This collaborative effort aims to reduce poverty in Palm Beach County and create pathways to economic mobility for families with children living below 200 percent of the federal poverty level. The county also created an Office of Diversity, Equity and Inclusion to ensure that all county programs, including the Securing Our Future Initiative, are equitable.27 The initiative highlights housing as one of the eight domains most pertinent to economic mobility, particularly as the county faces significant housing challenges like many other coastal counties. In 2017, 32 percent of Palm Beach County homeowners and 60 percent of renters were cost-burdened, both rates well above the national averages.28

Palm Beach County adopted a Home Rule charter and therefore has relatively high autonomy over local affairs. The county can deploy a broad range of housing policy tools to promote economic mobility under Florida State law. These tools include: (1) making ordinances and directing expenditures to increase affordable housing within the county, (2) issuing bonds to fund affordable housing development, and (3) instituting interlocal agreements with other counties, cities, the state and federal government.29 In 2004, the Palm Beach County Board of County Commissioners adopted Ordinance No. 2004-027 to create the county’s Workforce Housing Program (WHP) in the countywide Comprehensive Plan. This program is a partnership between the county's Department of Planning, Zoning and Building and the Department of Housing and Economic Sustainability and is mandatory for all developments in the county's unincorporated areas through land development codes. The program requires developments to designate a percentage of their residential units to the needs of households whose income falls between 60 and 140 percent of Area Median Income (AMI).
Outcomes
As of 2021, more than 90 housing projects in Palm Beach County are subject to the WHP. Also, the program requires more than 2,400 WHP units (13 percent of total units), half of which are either built or under development. The greatest beneficiaries of the WHP are racial and ethnic minorities; among all the workforce unit occupants, 47 percent are Black, and 35 percent are Hispanic. Additionally, the program received $9.1 million in-lieu fees from developers who opted to a buyout of the mandatory workforce unit requirements. Some of this revenue provides down payment assistance for WHP unit purchasers.
In addition to the WHP, Palm Beach County also provides local match for the statewide Low Income Housing Tax Credits program targeting multifamily developers. Additionally, the Palm Beach County Housing Finance Authority – a dependent special district of Palm Beach County created pursuant to state statutes – offers through lending institutions second mortgage loans and non-repayable assistance grants for qualified home purchases and issues loans and tax-exempt bonds for the development or acquisition and rehabilitation of affordable housing units. Through these policies and programs, Palm Beach County provides a great example of leveraging granted powers to foster upward mobility by providing stable and affordable homes for residents. Specifically, residents can accumulate savings over lowered housing costs and connect to quality education and employment opportunities, allowing them to climb the income ladder.
For more information, see:
- County Authority: Dillon’s Rule
- Population (2020): 406.2k
- Size of Labor Force (2020): 220.5k
- Unemployment Rate (2020): 5.6%
- County Economic Output (2019): $28B
- Median Household Income (2019): $87.3k
- Top Three Industries by Economic Output (2019): Manufacturing; Professional & Business Services; Wholesale Trade
- Sources: See endnote 30.
- Learn More
Key Program Tenets<
- Multi-county housing consortium
- Expand homeownership opportunities and maintain current housing stock
- Consortium programs include down payment assistance for homebuyers and low-interest housing rehabilitation loans
- Consortium leverages federal funding to tackle regional housing affordability issues
Community Impacts
- Provided down payment assistance to over 55 families buying their first home
- As of 2017, 25 families participated in the Housing Rehabilitation program and 16 families participated in the Purchase Rehabilitation program
Overview
Wisconsin counties have administrative Home Rule authority, which provides some flexibility. However, state legislation limits these county powers to administrative and organizational functions. Under state law, Wisconsin counties can form partnerships with the state, other counties, and municipalities for various projects, including acquisition, development, remodeling, construction, operation and maintenance of land, buildings, and facilities, among other things. Waukesha County, Wis. leveraged these granted powers to partner with neighboring counties to tackle housing affordability issues in the region. In 1998, Waukesha County, serving as the lead entity, joined together with neighboring counties Jefferson and Washington to establish the HOME Consortium (later joined by Ozaukee County). In this case study, Consortium refers to the HOME Consortium. Empowered by a formal resolution adopted by nearly all the municipalities within the participating counties, a 12-member board of directors comprising elected representatives from all four counties governs the Consortium.

The Consortium's principal goals include advancing homeownership opportunities and maintaining the quality of existing housing stock. In pursuit of these goals, the Consortium operates three core programs that provide support to eligible families. They include a homeownership assistance program, a homeowner purchase or rehab program and a home rehabilitation assistance program. Under these programs, the Consortium offers down payment assistance for homebuyers and low-interest housing rehabilitation loans to residents that earn 80 percent or less of the area's median household income.
Outcomes
The Consortium funds programs with an annual federal allocation of about $1,000,000 from the U.S. Department of Housing and Urban Development (HUD) through the HOME Investment Partnerships Program (HOME) to address affordable housing issues.31 The housing development fund, another program created by the Consortium, is a fund that assists with the construction of affordable housing in the four counties. HUD requires each participating jurisdiction in the Consortium to set aside at least 15 percent of its funding for Community Housing Development Organizations (CHDOs). CHDOs are entities through which jurisdictions can provide decent, affordable housing to low-income households in a specific area or community, but not the entire state.

The Consortium’s programs have supported many families. In 2017, 55 families received down payment assistance for their first home; 25 families participated in the Housing Rehabilitation program; and 16 families participated in the Purchase Rehabilitation program.32 The Consortium is an example of how counties can use partnership-forming powers to foster upward mobility within communities.
For more information, make sure to check out:
- County Authority: Home Rule
- Population (2020): 328.2k
- Size of Labor Force (2020): 184.5k
- Unemployment Rate (2020): 5.2%
- County Economic Output (2019): $25B
- Median Household Income (2019): $121.2k
- Top Three Industries by Economic Output (2019): Professional & Business Services; Real Estate & Rental and Leasing; Wholesale Trade
- Sources: See endnote 33.
- Learn More
Key Program Tenets
- Addresses affordable housing issues, especially among moderate to low-income residents
- Program requires developers of new housing in specific zoning districts to rent a portion of the units to eligible households
- Under the program, households do not spend more than 33 percent of their income on housing-related costs
Community Impacts
- Steady growth in rental inventory, 600 units as of Fiscal Year 2019
- Expanded on local affordable housing incentive strategies by launching a down payment loan program to support homebuyers in the community
Overview
Howard County is a medium-sized county located in central Maryland.34 The county is one of the state’s geographically smallest – occupying approximately 250 square miles – and one of the nation’s wealthiest – with a median household income of nearly $118,000.35 Like many other counties across the nation, Howard County is facing housing affordability challenges. Nearly half of renters in the county (45 percent) are cost-burdened, six percentage points below the national average of 51 percent.36

The county launched its Moderate Income Housing Unit (MIHU) Rental and Ownership programs to address affordable housing issues, especially among moderate to low-income residents, such as teachers, firefighters, law enforcement officers, hospital workers and service workers.37 The MIHU Rental Program requires developers of new housing in specific zoning districts to rent a portion of the dwelling units (typically 10 to 20 percent) to moderate-income households. The purpose of this affordability program is to balance the cost of living in a rental unit against the household's annual income. The intent is that a household should not spend more than 33 percent of its income on expenses related to the rental unit. First adopted in 1996, the MIHU Rental program has steadily grown its rental inventory to 600 units as of Fiscal Year 2019.
Outcomes
In addition to the renter program, the county also implemented the Moderate Income Housing Unit (MIHU) Ownership Program and the related Settlement Downpayment Loan Program (SDLP) as two initiatives to help address the growing affordability needs for homebuyers in the community. The MIHU Ownership program requires developers of new housing in targeted zoning areas to sell a portion of their units to moderate-income households at a reduced price based on county code. Nearly half of the homebuyers in the MIHU Ownership program also need settlement down payment assistance. As a result, the SDLP program has become a vital component to the success of the MIHU program. Developers seeking alternative compliance to the MIHU program can request to pay a fee-in-lieu for each unit in a development project in certain situations and specific zones. The revenue collected from the fee-in-lieu funds the SDLP loans. As of Fiscal Year 2019, the MIHU Ownership program placed 287 moderate income families in homes.38

Local governments in Maryland have strong planning and zoning authorities. The state establishes comprehensive plans, but the counties manage specifics such as reviewing, updating and adopting the plan in whole or in part. Howard County adopted its Home Rule charter in 1968, which includes the authority to control zoning. The Howard County Department of Housing and Community Development administers all housing initiatives in the county, including the MIHU Programs. The department uses funds from a portion of the county's overall transfer tax (12.5 percent) and all fee-in-lieu revenue to create, rehabilitate and preserve affordable housing in Howard County.39
For more information, make sure to check out:

Education & Workforce Development
Education and workforce development are key elements to success as they helps break the cycle of poverty and inequality and fosters mobility in current and future generations.
Education
Education is a key element to success as it helps break the cycle of poverty and inequality and fosters mobility in current and future generations. In the United States, the structure of the education system can be viewed as having three levels of formal education, that is, elementary (including prekindergarten and kindergarten), secondary and postsecondary. Each of these levels of education contributes to ensuring that individuals have the chance to move up the economic ladder across generations. Though the role of counties in education varies by state, education is the third largest source of expenditures for counties nationwide. In 2017, counties invested $103 billion in education, which includes the construction and maintenance of public-school buildings and support of higher education institutions, such as community colleges.40
Education helps break the cycle of poverty and inequality, fostering mobility in current and future generations.
Access to a high-quality education is a key determinant of child-related outcomes.41 People with access to quality and higher levels of education are more likely to be healthier and live longer.42 Furthermore, individuals with post-secondary education credentials have access to increased employment opportunities and are likely to earn higher wages and experience better health outcomes than those without post-secondary education training.43 In addition, investing in early childhood education reduces the need for more expensive interventions later and produces higher returns.44 County programs and investments expand young children’s access to high-quality services and support which promote healthy development of the cognitive and socioemotional capabilities that are crucial to generating economic success as adults. Such programs include early care and education, home visiting, perinatal services, parenting classes and centralized intake and referral systems. For example, Tarrant County, Texas offers a comprehensive developmental screening program for infants and toddlers through a public-private partnership to increase the early detection of developmental delays in children (see Tarrant County, Texas case study).
In some cases, counties support early childhood efforts through administering federal childcare programs, though they are primarily regulated at the state level.45 In at least eight states, county governments are responsible for administering the Child Care and Development Fund (CCDF).46 Counties also play a significant role in licensing childcare providers, offering childcare assistance to low-income residents, referring families to childcare resources and providing local funding to help build the supply of childcare.47 For example, Franklin County, Ohio administers the state’s publicly funded childcare program (supported by the federal Child Care and Development Block Grant and Temporary Assistance for Needy Families, or TANF). Franklin County also funds free training for childcare providers in the county.
County programs and investments expand young children’s access to high-quality services and support which promote healthy development of the cognitive and socioemotional capabilities that are crucial to generating economic success as adults.
In the context of K-12 public education, counties in some states fund the public education system. In most instances, a separate elected board of education in each county works with the state’s department of education to operate, administer and manage the public education system. County leaders also play a role in post-secondary education, including making direct allocation of local funds, participating in decision-making boards and bodies and coordinating various local, state and federal resources to improve educational outcomes for residents.48
Workforce Development
Counties either directly provide, through county-based human services agencies, or partner with post-secondary education institutions and community-based organizations to provide workforce development and employment services such as vocational and on-the-job training services that boost the skills of residents.
Workforce development is another key driver of upward economic mobility. Workforce development increases human capital – knowledge and skills – of individuals that help prepare them for better employment opportunities. Such interventions are critical for improving intragenerational mobility particularly for workers in low-wage occupations and those displaced from the labor market due to skills mismatch or lack of access to jobs that do not require a college degree.49 Counties either directly provide, through county-based human services agencies, or partner with post-secondary education institutions and community-based organizations to provide workforce development and employment services such as vocational and on-the-job training services that boost the skills of residents. For example, the career office of Coconino County, Ariz. is implementing several initiatives to create a youth talent pipeline, engage key partners in their workforce system and develop employment and educational training programs (see Coconino County, Ariz. case study). These strategies, coupled with contributions to education, can enhance post-secondary enrollment and graduation rates and expand opportunities for stable, high-quality jobs.
In other cases, counties act as key conveners of stakeholders, partnering with private sector organizations, nonprofits and municipal, state and the federal government to offer workforce development programs and services.
In other cases, counties act as key conveners of stakeholders, partnering with private sector organizations, nonprofits and municipal, state and the federal government to offer workforce development programs and services. Franklin County, Ohio works with the Columbus Urban League, a local civil rights nonprofit, and a regional construction trades council to recruit low-income, TANF eligible residents – particularly men of color – to participate in a 12-week pre-apprenticeship program in construction trades. This program offers soft and hard skills training and places participants in different local apprenticeships upon program completion (see Franklin County, Ohio case study).
Spotlight
About Tarrant County, Texas
- County Authority: Dillion’s Rule
- Population (2020): 2.1M
- Size of Labor Force (2020): 1.1M
- Unemployment Rate (2020): 7.3%
- County Economic Output (2019): $106.8B
- Median Household Income (2019): $67.7k
- Top Three Industries by Economic Output (2019): Manufacturing; Real Estate & Rental and Leasing; Professional & Business services
- Sources: See endnote 50.
- Learn More
Key Program Tenets
- Community partnership
- Supports early childhood developmental screenings
- Coordinates a referral system
Community Impacts
- Over 83,000 infants and toddlers served across the county
- Sets children on a path for school readiness and long-term economic self-sufficiency
Overview
Located in the Dallas-Fort Worth metro area, Tarrant County is the third largest county in Texas, with over 2.1 million residents.51 The county has a civilian labor force of just over 1 million workers and its unemployment rate stood at 3.3 percent before the pandemic.52 The Tarrant County median household income is higher than the national median.53 However, more than 109,000 children live in high poverty areas – that is, areas with a poverty rate of 20 percent or more – within the county.54 The county’s 13.9 percent child poverty rate is slightly lower than the national rate.55

Counties play a role in shaping the well-being and the path of economic success of the youngest residents by administering comprehensive early childhood systems and maintaining high-quality learning environments that stimulate growth and development.
Early childhood is a critical phase in one’s lifetime as early childhood experiences establish the foundation for an individual’s success, self-sufficiency and well-being later in life. This phase is fundamental to a child’s developmental well-being due to the potential for growth, and vulnerability to risk factors that can harm a child’s physical health, cognition and social-emotional skills.56 These risk factors can be biological (e.g., premature birth, low birthweight) or related to the one’s socio-economic environment (e.g., poverty, housing instability, family structure or relationship with caregivers).57
The county recognized a need for a coordinated system to support healthy development and strengthen the school readiness of the 83,000 infants and toddlers within its community.
Outcomes
Counties play a role in shaping the well-being and the path of economic success of the youngest residents by administering comprehensive early childhood systems and maintaining high-quality learning environments that stimulate growth and development. Early childhood interventions such as developmental screenings – which allow for the identification of possible health or developmental problems in infants and young children – are an important tool to guarantee children are on target for a healthy development ensuring their success later in life. An example of a county developmental screening program is the Infant Toddler Developmental Screening Initiative (ITDSI) developed by Tarrant County. The county recognized a need for a coordinated system to support healthy development and strengthen the school readiness of the 83,000 infants and toddlers within its community. Tarrant County partnered with the Early Learning Alliance and the Infant Health Network to form the ITDSI. The initiative's goal is to implement a robust developmental screening and referral system that will increase the early detection of developmental delays. The information gathered from the new system enables the county to provide children with the necessary resources and support to improve their education and promote positive long-term economic outcomes. Tarrant County’s Public Health Department supports this initiative by ensuring collaboration between all stakeholders involved and connecting the community’s public health system to early childhood education programs and services.
Early childhood development or intervention programs promote the development of capacities during childhood that are the foundation for school readiness and economic self-sufficiency. These factors correlate with positive education outcomes that translate to higher incomes and success later in life; initiatives such as Tarrant County’s system are an example of how counties can enact programs to improve economic mobility for younger generations within the community.58
For more information, be sure to check out:
- County Authority: Dillon’s Rule
- Population (2020): 1.3M
- Labor Force (2020): 705.1k
- Unemployment Rate (2020): 7.4%
- Median Household Income (2019): $61.3k
- Poverty Rate (2019): 13.5%
- County Economic Output (2019): $87.8B
- Top Three Industries by Economic Output (2019): Professional & Business Services; Government & Government Enterprises; Finance & Insurance
- Sources: See endnote 59.
- Learn More
Key Program Tenets |
|
Community Impacts |
|
Overview
For decades, Franklin County, Ohio, the most populous county in the state, has been battling concentrated and persistent poverty. Between 1980 and 2016, 60 percent of census tracts in Franklin County experienced an increase in poverty.60 Additionally, 30 percent of all children live in areas with poverty rates of 20 percent or more.61 The county also suffers from high levels of wealth segregation. The Columbus metro area is one of the most economically segregated regions in the country.62
To mitigate local poverty and improve economic mobility, Franklin County commissioners focused on strengthening local partnerships. The state grants Ohio counties the authority to enter into agreements with other public and private entities and to appropriate funds to nonprofits engaged in promoting economic development.63 In late 2018, the county convened local partners across Central Ohio, leading to the Rise Together blueprint. The blueprint is an organizing framework with 13 goals to reduce poverty in Franklin County and corresponding immediate, short-term and long-term action steps.64 One example of a program outlined in the blueprint is Building Futures, a pre-apprenticeship program that provides low-income Franklin County residents with training in skilled construction trades. The program brings together Franklin County, the Columbus/Central Ohio Building and Construction Trades Council and the Columbus Urban League. The Building Futures program is funded both through the Temporary Assistance for Needy Families (TANF) program and by the county general fund. The latter provides wrap-around supportive services that help ensure participants complete the program.

Outcomes
Since Building Futures' inception in 2017, the program has trained more than 100 participants, of which nearly 90 percent are Black. Eighty-five (85) percent of participants graduated, and 88 percent quickly secured employment with starting wages ranging from $15 to $26 per hour plus full benefits.65 Other education and workforce training programs enacted or supported by Franklin County to foster resiliency and upward mobility include Achieve More and Prosper and Columbus Work.
Poverty and economic segregation negatively impact upward mobility. Residents who live in concentrated poverty areas are isolated from resources and networks needed to thrive and achieve successful economic outcomes. Workforce training programs such as Building Futures are one of many ways counties can generate better economic outcomes for residents.
For more information, see:

Health
From running local health departments, providing behavioral and mental health services to developing community health care programs, counties play a direct role in the health and well-being of residents/
Health
From running local health departments, providing behavioral and mental health services to developing community health care programs, counties play a direct role in the health and well-being of residents (see Fulton County, Ga. case study). In total, counties invest over $100 billion in community health and hospitals annually.72
Additionally, for children, poor nutrition negatively affects their developmental outcomes, leading to long-lasting impacts on their future economic status.
Discussions of health tend to focus on physical and psychological well-being. Still, health also plays a key role in individuals’ economic outcomes. Studies show that good health, including nutritional diets, access to health insurance and quality healthcare in childhood, can impact an individual’s socioeconomic outcomes in several ways.73 A non-nutritional diet can contribute to serious health conditions, preventing residents from earning a stable income.74 Poor nutrition also negatively affects educational outcomes such as school readiness and performance.75 Additionally, for children, poor nutrition negatively affects their developmental outcomes, leading to long-lasting impacts on their future economic status.76
Good health habits, and access to affordable and quality healthcare are linked to positive socioeconomic outcomes.
Health can also impact one’s economic outcomes through healthcare costs. Thus, health insurance is essential to economic mobility for several reasons (see Pinellas County case study). Those with health insurance are more likely to access medical care to help maintain good physical and mental health and thereby increase economic mobility.77 Hospitals can charge the uninsured more than those with health coverage, leading to medical debt as uninsured individuals pay out of pocket for most of their care.78 Consequently, residents are pushed further down the economic mobility ladder.79
The levers counties can leverage to improve health outcomes in communities and subsequently impact economic mobility vary among jurisdictions. For example, in Georgia, counties partially fund the local public health department and appoint individuals to community health boards. Similarly, each county in Maryland jointly oversees the local public health department. Though in Maryland, these entities are primarily the local arm of the state health department such that the health officer is a joint employee of the county and the state. On the other hand, in the public health arena, Oregon counties serve as the local public health authority and operate without much preemption by state statutes, despite having limited resources.

Community & Economic Development
Across the nation, counties are actively working to make communities better places to live and work.
Community & Economic Development
Across the nation, counties are actively working to make communities better places to live and work. Various aspects of an individual’s life, including education and access to employment opportunities are centered around geography (or place). Since the county is in many areas the closest government to the people, county leaders know the needs of local communities best and where to allocate resources most efficiently. Each year, counties spend over $20 billion on public amenities, including libraries, parks and natural resources.95 County governments also invest nearly $13 billion annually on housing and community development and over $23 billion on transit options for residents.96 Additionally, counties are well-positioned to convene business and community leaders, often forming task forces and other groups to stimulate economic activity and tackle key economic issues (see Erie County, Pa. case study).
It is important to recognize the intersection between geography and an individual’s economic outcomes because: (1) economic mobility is unevenly distributed across the nation and (2) neighborhood characteristics impact key mechanisms that influence an individual’s economic outcomes.
There is substantial geographic variation in economic mobility levels across the nation. At the regional level, many northeastern states have much higher economic mobility levels than many southern states.97 Economic mobility can even vary within regions, such as commuting zones.98 For instance, children from low-income families in Charlotte, N.C. are only 4.4 percent likely to reach the top fifth of the income distribution, contrasted to a 12.9 percent likelihood for children from San Jose, Calif.99
Children's long-term health, well-being and future economic outcomes are impacted by the neighborhood they grow up in.
Neighborhood or community features impact an individual’s economic trajectory.100 Children's long-term health, well-being and future economic outcomes are impacted by the neighborhood they grow up in. Families and children experience significant outcome improvements as they move to high-upward mobility neighborhoods.101 For instance, children from low-income families that move to low-poverty neighborhoods are more likely to attend college and earn more as adults.102 In addition, a neighborhood will have a better impact on the children and families living there if it has lower rates of segregation and inequality by income and race, lower violent crime rates, better education (or high quality schools) and more two-parent households.103 This is evidence in the fact that poor intergenerational mobility for Black Americans is driven in part by generations of racial inequality and historical patterns of racial segregation.104
A neighborhood will have a better impact on the children and families living there if it has lower rates of segregation and inequality by income and race, lower violent crime rates, better education (or high quality schools) and more two-parent households.
Counties are working to foster mobility by addressing gaps other neighborhood characteristics such as public parks, recreation facilities and reliable and efficient transit options (see Mercer County, W.Va. case study). Efficient transportation provides access to community resources and amenities that allow individuals or families to improve their economic outcomes (see Hennepin County, Minn. case study). Additionally, high-performing transportation networks dictate accessibility to housing, employment, education and healthcare – all of which influence economic mobility105 (see Loudoun County, Va. case study). Most importantly, public transit allows residents to access community resources and amenities, regardless of their ability to own or operate a personal means of transportation106 (see Nassau County, N.Y. case study). Transportation is the second-largest expense after housing for households in the United States.107

Justice & Public Safety
In the United States, counties play a critical role in administering justice and public safety services.
Justice & Public Safety
In the United States, counties play a critical role in administering justice and public safety services. Counties support 91 percent of all local jails, processing 11 million admissions every year; invest $28.7 billion in correctional facilities; and incur $20.9 billion in court costs and legal services.130 Additionally, most counties retain police and sheriff’s departments to promote public safety, investing over $42 billion in these services annually.131
Even short stays in jail while awaiting trial can have negative consequences, such as the accumulation of criminal justice fees. The inability to pay these costs, which can quickly accumulate into the thousands of dollars, can result in further penalties such as suspended drivers’ licenses that can prevent the individual from returning to work, resulting in a cycle of continued loss of economic opportunity.132 After release from jails or prison, people continue to face longstanding challenges securing adequate employment. Formerly incarcerated people work fewer weeks each year, earn less money and have limited upward mobility.133 Furthermore, employment prospects for formerly incarcerated individuals are diminished due to negative stigmas, usually forcing individuals into lower-wage or undesirable employment.134
Counties improve long-term economic outcomes by reducing disparities in the justice system and the delivery of public safety services.
People who receive support to stay out of jail through diversion programs that offer employment, housing and health care services have lower recidivism rates and better life outcomes. The relationship between economic mobility and penalties from incarceration is particularly salient for communities of color, such as low-income Black men who experience higher arrest rates.135
With counties positioned to play such a key role in justice and public safety, many levers are available to promote economic mobility. One such lever is justice reform measures, such as those implemented in Georgia, which help reduce jail populations – specifically for people charged with nonviolent offenses. Additionally, diversion programs such as work release, education and records expungement (where applicable) help to reduce the economic penalties of incarceration in Georgia counties.
In Oregon, counties can oversee local committees to review data, policies and practices to enhance public safety, improve services to people involved in the justice system and promote equitable criminal justice policies. Counties in Oregon also work to address the needs of people with mental illness who are involved in the criminal legal system through diversion programs that offer treatment and services instead of jail.
In pursuing justice and public safety levers, counties can promote positive solutions that improve individual and family outcomes by providing services and supports that reduce recidivism and increase employment prospects while fostering safe communities. This is at the heart of providing opportunity for economic mobility.

Technology & Information Access
An increasingly crucial area of economic mobility is an individual’s access to technology and information.
Technology & Information Access
One crucial area of economic mobility – which has become increasingly apparent throughout the coronavirus pandemic – is an individual’s access to technology and information. Counties are working as catalysts for broadband investment in communities (see Erie County, Pa. case study) and broadband is increasingly available to most of the population, with 73 percent of adults having high-speed broadband at home in 2019.147 Communities lacking broadband access skew heavily towards lower-income (56 percent of those making less than $30,000 annually have broadband), lower-educational attainment (46 percent of those without a high school diploma have access) and rural communities (63 percent of those in rural communities have broadband access).148
On the national level, county leaders have banded together to form a task force of over 30 members to advocate for increased broadband investment in local communities.149 Counties in Ohio work with the municipalities and cities to lead the way in broadband and technology investment with a focus on bringing broadband into rural areas through partnerships to expand access, and into underserved urban areas by working to increase the affordability of these tools.
Oregon counties may act as a provider of broadband and telecommunication services to local communities – even those outside their county – though this presents unique barriers. Most Oregon counties promote broadband investment by actively discussing investment with state and private partners (see Multnomah County, Ore. case study). Similarly, Georgia counties are active in these same discussions surrounding broadband and worked with the private industries on 5G deployment with incentives specifically targeting deployment in rural communities through new state legislation.
The advancement of economic mobility is intertwined with access to technology, information and digital literacy.
Increased broadband access provides opportunities for employment, income creation and provides a means of connection to other resources or information. Also important is technology, like computers and smartphones, and the digital literacy to use such devices.

Financial Security
Financial security means accessibility to funds that can provide basic requirements like shelter, food, water and ancillary needs.
Financial Security
Financial security means accessibility to funds that can provide basic requirements like shelter, food, water and ancillary needs. Nearly half (49 percent) of Americans expected to live paycheck to paycheck in 2020160 according to a pre-pandemic survey, and the share of workers reportedly living paycheck to paycheck has only increased throughout the pandemic, to roughly 63 percent.161 Financial security’s ties to economic mobility have only become exacerbated by the coronavirus pandemic since the economic impacts have concentrated among lower-income individuals. Similarly, Black Americans, who historically have been among the less financially secure, are more likely to draw upon retirement savings when faced with economic hardships.162 Even those moving upwards economically are often disadvantaged if they are not financially secure. 163
Achieving financial security relies on the attainment of three pillars: routinely positive cash flow, personal resources and public and private benefits.164 At the county level, the translation from these pillars to public policy is varied. For instance, social service programs in Georgia counties, such as unemployment insurance and SNAP benefits, which fall under the public and private benefits pillar, are administered at the state level.
County authority related to routinely positive cash flow is slightly more flexible. Though usually limited to discussion in the context of the direct county workforce (county employees), authority related to routinely positive cash flow extends into other areas such as schooling. A significant relationship between K-12 school quality and earnings later in life suggests quality education in the formative years is important to achieving a routine positive cash flow as an adult.165 Furthermore, addressing needs outside of the classroom through the form of extracurricular services and resources are proven measures that lead to increased earnings later in life – especially for less-advantaged children – thus strengthening financial security and supporting upward mobility166 (see Bernalillo County, N.M. case study).
However, the pillar to which county authority generally lends the most breadth in supporting financial security is the personal resources pillar. The personal resources pillar consists of savings and financial cushions, allowing for asset building and investment.167 Counties can promote and educate residents on saving for emergencies or retirement, facilitate programs to promote homeownership or enact workforce development programs to increase earning potential. Counties in Georgia have implemented solutions to bolster financial literacy by providing financial education or training to their community to help educate residents on smart financial habits such as saving for emergencies or retirement. In addition to these education methods, Georgia counties have the authority to convene partnerships with non-profit organizations providing services to individuals to help them become financially secure. Maryland counties may promote financial security by overseeing community colleges, workforce development boards and working with the state and non-profit organizations to promote homeownership programs.
The financial well-being of residents is related to both short-term financial stability and longer-term upward economic mobility.
Financially secure individuals can generally allocate more net income towards personal resource building such as homeownership, investments, savings and retirement funds or other forms of assets that can bolster mobility. One such example is in homeownership and affordable housing (see Mobile County, Ala. case study). Financing development projects for affordable single-family homes stimulate the supply side of the market, which also assists individuals to grow their resources by providing options for homeownership within the price range. Similarly, county incentives for developing affordable rental housing contribute to financial stability, and therefore economic mobility, by reducing costs associated with renting thereby helping individuals obtain routine positive cash flow.
Conclusion
Counties are one of the closest forms of government to people, making them uniquely positioned to develop approaches that improve individuals and families' economic opportunity and ensure support reaches those who need it most. Counties already play an instrumental role across several factors (i.e., education, housing, workforce development, health, etc.) that influence economic mobility. Therefore, counties have the tools necessary to drive inclusive and equitable upward mobility where residents have access to resources and are empowered to pursue their economic potential.
Because counties have distinct roles and authorities in these seven key factors, county policies and investments are particular effective solutions to uplift communities and residents and drive their upward mobility.
Neighborhoods with high upward mobility levels possess characteristics, such as less residential segregation, lower rates of inequality by income and race, lower violent crime rates, better educational opportunities and access to well-paying jobs, to name a few. Counties working within the power and authorities defined by the state can employ various levers such as policy and decision-making powers, program enacting or administering authority, and even form partnerships to foster equitable and inclusive economic mobility prospects.
NACo’s Economic Mobility Leadership Network is funded by the Bill & Melinda Gates Foundation. The findings and conclusions contained above are those of the authors and do not necessarily reflect positions or policies of the Bill & Melinda Gates Foundation.
The authors would like to thank every county official who participated in the Economic Mobility Leadership Network in 2019 and 2020, as they added diverse, invaluable insights to the work and without them it would not exist. Numerous county staff and staff of state county associations also contributed to the research of this report. The authors are also grateful to the Aspen Institute Financial Security Program, particularly Tim Shaw, who provides guidance and policy expertise in support of the cohort. The authors also express their appreciation to their Public Affairs colleagues for the graphic design and the website of the report. Finally, the authors would like to thank the Bill & Melinda Gates Foundation for their ongoing support of the project.
Within the National Association of Counties, the authors would like to thank Ricardo Aguilar, Victoria Akosile, Kiely Ford and Delaney Hertel for helping to develop the report. This report was prepared by Stacy Nakintu, Research & Data Analyst, Kevin Shrawder, Associate Economist, Katie Sullivan, Program Manager, Resilient Economies & Communities with guidance from Teryn Zmuda, Chief Economist and Director of the Counties Futures Lab, Ashleigh Holand, Director of Programs and Practices and Jonathan Harris, Associate Director of Research. The authors would also like to thank Alejandra Montoya-Boyer and Ruochen Wang for their contributions to this publication.
The authors would like to recognize three counties who have contributed to the success of the EMLN throughout its existence but did not participate in 2020: Bernalillo County, N.M., Garrett County, Md. and Washington County, Va.
To prepare this report, NACo relied on three efforts:
- Results of a survey of EMLN participating counties.
- Several in-depth interviews with county officials and staff, as well as state association staff.
- Feedback from county officials and staff on county case studies.
In 2019, NACo administered a survey to county officials from 20 EMLN participating counties. The survey consisted of several questions related to economic mobility. This study used responses to identify programs to highlight in the county case studies. The one-hour in-depth interviews allowed research staff to understand the powers and authorities of county governments across various issue areas (i.e., health, financial security, education, workforce development, etc.).
Absolute mobility: A measure of mobility that examines how likely an individual is to exceed their parents' income at a similar age.
Dillon’s rule: One of the forms of local government authority where counties can only exercise powers explicitly stated in state law and must obtain state approval for any changes in their structure, function or fiscal organization. Counties and municipalities must obtain permission from the state legislature to pass a law or ordinance which is not explicitly permitted under existing state legislation.
Economic mobility: The ability to move up and down the economic ladder either across a lifetime or across generations — usually measured in income.
Economic Mobility Leadership Network: A cohort of county leaders that examines the range of complicated issues that comprise economic mobility, including housing, food insecurity and an overall lack of opportunity.
Home Rule: Another form of local government authority where counties and municipalities are granted local autonomy or local self-determination without state interference through state constitutions or statutes. States may pass laws limiting the powers of counties, as opposed to passing laws that give powers (as seen in Dillon's rule states).
Home Rule charters: States grant limited authority to local governments by the passage of state statutes. The states mandate some form of Home Rule authority without formal grants of Home Rule power to counties.
Intra-generational mobility: A concept that examines changes in an individual's or group's income over their lifetime. It is also measured based on absolute or relative differences.
Inter-generational mobility: A concept that examines economic mobility across generations. Inter-generational mobility compares an individual's income as an adult relative to their parent's (or grandparent's) income at a similar age. It is also measured based on absolute or relative differences.
Relative mobility: A measure that examines the ranking of individuals' income on the income distribution compared to their parents, peers, or over their lifetime.
[1] Margery Austin Turner and others, “Boosting Upward Mobility: Metrics to Inform Local Action Summary” (Washington D.C.: Urban Institute, 2020).
[2] Aparna Mathur, Abby McCloskey and Erin Melley, “The American Dream in 2020: How to Strengthen It” (Washington, D.C.: American Enterprise Institute, 2020).
[3] Intergenerational Elasticity (IGE) measures the strength of the relationship between the income of parents and that of children. The IGE is interpreted as the percent increase in the expected income of children (when they are adults) given an additional percentage point of parental income. It is often used as a measure of economic mobility because it refers to the persistence in economic standing across generations. See Pew Charitable Trusts and the Russell Sage Foundation, “Economic Mobility in the United States” (2015).
[4] Raj Chetty and others, “Is the United States Still a Land of Opportunity? Recent Trends in Intergenerational Mobility.” Working Paper 19844 (National Bureau of Economic Research, 2014).
[5] Raj Chetty and others, “The Fading American Dream: Trends in Absolute Income Mobility Since 1940.” Working Paper 22910 (National Bureau of Economic Research, 2016).
[6] Miles Corak, “Income Inequality, Equality of Opportunity, and Intergenerational Mobility,” The Journal of Economic Perspectives (3) [2013]: 79–102.
[7] Raj Chetty and others, “Where is the Land of Opportunity? The Geography of Intergenerational Mobility in the United States.” Working Paper 19843 (National Bureau of Economic Research, 2014).
[8] Ibid.
[9] Ibid.
[10] Ibid.
[11] Ibid
[12] Ibid.
[13] Raj Chetty and Nathaniel Hendren, “The Impacts of Neighborhoods on Intergenerational Mobility I: Childhood Exposure Effects.” Working Paper 23001 (National Bureau of Economic Research, December 2016, Revised May 2017).
[14] Ibid.
[15] Raj Chetty and others, “Race and Economic Opportunity in the United States: An Intergenerational Perspective.” Working Paper 24441 (National Bureau of Economic Research, 2018).
[16] Ibid.
[17] Ibid
[18] Ibid.
[19] Counties in Utah are under “Hutchinson’s Rule” – which is something in between Dillon’s rule and Home rule. Basically, the counties are under Dillon’s Rule, but the courts are told to rule favorably on the side of counties.
[20] Ibid.
[21] Blumenthal and McGinty, “Housing Policy Levers to Promote Economic Mobility” Urban Institute (September 2015).
[22] NACo Analysis of U.S. Census Bureau – Census of Individual Governments: Finance data, 2017.
[23] Joint Center for Housing Studies of Harvard University, “The State of the Nation’s Housing 2020” (2020).
[24] The Aspen Institute, “Strong Foundations: Financial Security Starts with Affordable, Stable Housing” (2020).
[25] Ibid.
[26] In order of appearance, NACo Research, 2021; NACo Analysis of: U.S. Census Bureau, Population Estimates Program (PEP), 2020; U.S. Bureau of Labor Statistics, Local Area Unemployment Statistics (LAUS), 2020; U.S. Bureau of Labor Statistics, Local Area Unemployment Statistics (LAUS), 2020; U.S. Department of Commerce / Bureau of Economic Analysis / Regional Economic Accounts / Gross Domestic Product by County, 2019; U.S. Census Bureau, American Community Survey (ACS) and U.S. Department of Commerce / Bureau of Economic Analysis / Regional Economic Accounts / Gross Domestic Product by County, 2019.
[27] Katie Sullivan, “Member Profile: Commissioner Mack Bernard, Palm Beach County, Fla.” (2021), available at: https://www.naco.org/blog/member-profile-commissioner-mack-bernard-palm-beach-county-fla (May 4, 2021).
[28] NACo Analysis of U.S. Census Bureau – American Community Survey (ACS) One-Year Estimates, 2017.
[29] Matthew Sellers and Jacqueline Byers, “County Authority: A State-by-State Report” (Washington, D.C.: National Association of Counties, 2010).
[30] In order of appearance, NACo Research, 2021; NACo Analysis of: U.S. Census Bureau, Population Estimates Program (PEP), 2020; U.S. Bureau of Labor Statistics, Local Area Unemployment Statistics (LAUS), 2020; U.S. Bureau of Labor Statistics, Local Area Unemployment Statistics (LAUS), 2020; U.S. Department of Commerce / Bureau of Economic Analysis / Regional Economic Accounts / Gross Domestic Product by County, 2019; U.S. Census Bureau, American Community Survey (ACS) and U.S. Department of Commerce / Bureau of Economic Analysis / Regional Economic Accounts / Gross Domestic Product by County, 2019.
[31] The Home Consortium, “Funding” (n.d.), available at http://www.homeconsortium.info/about-us/funding/ (March 24, 2020).
[32] Waukesha County, “The HOME Consortium” (n.d.), available at https://www.waukeshacounty.gov/landandparks/community-development/learn-more-about/HOME%20Program/home-program/ (March 24, 2020).
[33] In order of appearance, NACo Research, 2021; NACo Analysis of: U.S. Census Bureau, Population Estimates Program (PEP), 2020; U.S. Bureau of Labor Statistics, Local Area Unemployment Statistics (LAUS), 2020; U.S. Bureau of Labor Statistics, Local Area Unemployment Statistics (LAUS), 2020; U.S. Department of Commerce / Bureau of Economic Analysis / Regional Economic Accounts / Gross Domestic Product by County, 2019; U.S. Census Bureau, American Community Survey (ACS) and U.S. Department of Commerce / Bureau of Economic Analysis / Regional Economic Accounts / Gross Domestic Product by County, 2019.
[34] NACo Analysis of U.S. Census Bureau – Population Estimates Program (PEP), 2019. NACo categorizes counties based on population size. Large counties have more than 500,000 residents, medium-sized counties have between 50,000 and 500,000 residents and small counties have less than 50,000 residents.
[35] NACo Analysis of U.S. Census Bureau – American Community Survey (ACS) Five-Year Estimates, 2014–2018 (Table B19049).
[36] NACo Analysis of U.S. Census Bureau – American Community Survey (ACS) Five-Year Estimates, 2012–2016 (Table B25070).
[37] See Howard County MIHU Homeownership Information Workshops PowerPoint Presentation, “Moderate Income Housing Unit Program: Making Housing Dreams Come True” (2021), available at https://www.howardcountymd.gov/LinkClick.aspx?fileticket=U2d6yOIDFs0%3d&tabid=2837&portalid=0 (March 24, 2021).
[38] NACo interview with Howard County, 2021.
[39] Ibid.
[40] NACo Analysis of U.S. Census Bureau – Census of Individual Governments: Finance, 2017.
[41] Reuben Finighan and Robert Putnam, “A Country Divided: The Growing Opportunity Gap in America” (Federal Reserve Bank of St. Louis, 2017).
[42] U.S. Department of Health and Human Services. Office of Disease Prevention and Health Promotion, “Education Access and Quality, “available at https://health.gov/healthypeople/objectives-and-data/browse-objectives/education-access-and-quality (June 15, 2021).
[43] See Elizabeth M. Lawrence, “Why Do College Graduates Behave More Healthfully than Those Who Are Less Educated?” Journal of Health and Social Behavior 58 (3) (2017): 291–306 and Jennifer Ma, Matea Pender, and Meredith Welch, “Education Pays 2019: The Benefits of Higher Education for Individuals and Society” (College Board, 2019).
[44] Center on the Developing Child at Harvard University, “Brain Architecture, “available at https://www.thencit.org/sites/default/files/2020-03/Brain Science Infographic.pdf (June 16, 2021).
[45] National Association of Counties (NACo), “NACo Legislative Brief: Proposals to Address The Covid-19 Child Care Crisis” (2021), available at https://www.naco.org/sites/default/files/documents/NACo Legislative Brief - Proposals to Address the COVID 19 Child Care Crisis_Jan 2021.pdf (June 15, 2021).
[46] Ibid.
[47] Ibid.
[48] National Association of Counties (NACo), “Counties at Work Counties Support Post-Secondary Education and Workforce Opportunities for Residents” (2021), available at https://www.naco.org/resources/featured/counties-supporting-postsecondary-education-systems-and-workforce-opportunities (June 15, 2021).
[49] Alan Berube, “Three things that matter for upward mobility in the labor market” (2019), available at: https://www.brookings.edu/blog/the-avenue/2019/01/15/three-things-that-matter-for-upward-mobility-in-the-labor-market/ (March 24, 2021).
[50] In order of appearance, NACo Research, 2021; NACo Analysis of: U.S. Census Bureau, Population Estimates Program (PEP), 2020; U.S. Bureau of Labor Statistics, Local Area Unemployment Statistics (LAUS), 2020; U.S. Bureau of Labor Statistics, Local Area Unemployment Statistics (LAUS), 2020; U.S. Department of Commerce / Bureau of Economic Analysis / Regional Economic Accounts / Gross Domestic Product by County, 2019; U.S. Census Bureau, American Community Survey (ACS) and U.S. Department of Commerce / Bureau of Economic Analysis / Regional Economic Accounts / Gross Domestic Product by County, 2019.
[51] NACo Analysis of U.S. Census Bureau – Population Estimates Program (PEP).
[52] NACo Analysis of Bureau of Labor Statistics – Local Area Unemployment Statistics (LAUS).
[53] Tarrant County’s median household income is $4,857 above the national median household which is 65,712. NACo Analysis of U.S. Census Bureau – American Community Survey (ACS) Five-Year Estimates.
[54] NACo Analysis of U.S. Census Bureau, Small Area Income and Poverty Estimates, 2019.
[55] Ibid.
[56] Laurie M. Anderson and others, “The Effectiveness of Early Childhood Development Programs: A Systematic Review,” American Journal of Preventive Medicine 24 (3) (2003): 32–46.
[57] Ibid.
[58] Raj Chetty and others, “Economic Mobility” (2015), available at https://inequality.stanford.edu/sites/default/files/SOTU_2015_economic-mobility.pdf (March 24, 2021).
[59] In order of appearance, NACo Research, 2021; NACo Analysis of: U.S. Census Bureau, Population Estimates Program (PEP), 2020; U.S. Bureau of Labor Statistics, Local Area Unemployment Statistics (LAUS), 2020; U.S. Bureau of Labor Statistics, Local Area Unemployment Statistics (LAUS), 2020; U.S. Department of Commerce / Bureau of Economic Analysis / Regional Economic Accounts / Gross Domestic Product by County, 2019; U.S. Census Bureau, American Community Survey (ACS) and U.S. Department of Commerce / Bureau of Economic Analysis / Regional Economic Accounts / Gross Domestic Product by County, 2019.
[60] See Franklin County Board of Commissioners, “Rise Together: A Blueprint for Reducing Poverty in Franklin County” (2019), available at https://commissioners.franklincountyohio.gov/COMM-website/media/Documents/FRANK-Report-1-10-Web-Ready-(Large)_1.pdf (March 24, 2021).
[61] NACo Analysis of U.S. Census Bureau, Small Area Income and Poverty Estimates 2017; U.S. Census Bureau, American Community Survey 2013–2017 5-year Estimates.
[62] See, for example, Martin Prosperity Institute, “Segregated City: The Geography of Economic Segregation in America’s Metros” (2015), available at https://community-wealth.org/sites/clone.community-wealth.org/files/downloads/report-florida-mellander.pdf (March 24, 2021).
[63] Sellers and Byers, “County Authority: A State-by-State Report.”
[64] Ibid.
[65] Columbus Urban League, “Building Futures” (n.d.), available at https://www.cul.org/initiatives/building-futures/ (March 24, 2021).
[66] In order of appearance, NACo Research, 2021; NACo Analysis of: U.S. Census Bureau, Population Estimates Program (PEP), 2020; U.S. Bureau of Labor Statistics, Local Area Unemployment Statistics (LAUS), 2020; U.S. Bureau of Labor Statistics, Local Area Unemployment Statistics (LAUS), 2020; U.S. Department of Commerce / Bureau of Economic Analysis / Regional Economic Accounts / Gross Domestic Product by County, 2019; U.S. Census Bureau, American Community Survey (ACS) and U.S. Department of Commerce / Bureau of Economic Analysis / Regional Economic Accounts / Gross Domestic Product by County, 2019.
[67] Coconino County, “Workforce Business Plan — Coconino County Local Workforce Area: July 1, 2017 — June 30, 2021” (n.d.), available at https://coconino.az.gov/DocumentCenter/View/28016/Workforce-Development-Plan---March-2019?bidId= (March 24, 2021).
[68] Ibid.
[69] NACo Analysis of U.S. Department of Commerce / Bureau of Economic Analysis / Regional Economic Accounts / Gross Domestic Product Data by County, 2018.
[70] Coconino County, “Workforce Business Plan — Coconino County Local Workforce Area: July 1, 2017 — June 30, 2021.”
[71] Coconino County, “Manufacturing Sector Innovations: Coconino Connection for Advanced Manufacturing Sector Excellence” (n.d.), available at https://coconino.az.gov/1137/Manufacturing-Sector (March 24, 2021).
[72] NACo analysis of: Centers for Medicare and Medicaid Services data, 2016; U.S. Department of Health & Human Services data, 2018; NACCHO (National Association of County and City Health Officials) data, 2016; Census of Governments Data, 2017.
[73] Jessica Kronstadt, “Health and Economic Mobility” (Washington, D.C.: Urban Institute, 2008).
[74] Ibid.
[75] Laurie M Anderson, Carolynne Shinn, Mindy T Fullilove, Susan C Scrimshaw, Jonathan E Fielding, Jacques Normand, Vilma G Carande-Kulis, “The effectiveness of early childhood development programs: A systematic review,” American Journal of Preventive Medicine 24 (3) (2003): 32–46.
[76] Ibid.
[77] Ibid.
[78] Jennifer Tolbert, Kendal Orgera, and Anthony Damico, “Key Facts about the Uninsured Population” (2020), available at https://www.kff.org/uninsured/issue-brief/key-facts-about-the-uninsured-population/ (March 24, 2021).
[79] Ibid.
[80] In order of appearance, NACo Research, 2021; NACo Analysis of: U.S. Census Bureau, Population Estimates Program (PEP), 2020; U.S. Bureau of Labor Statistics, Local Area Unemployment Statistics (LAUS), 2020; U.S. Bureau of Labor Statistics, Local Area Unemployment Statistics (LAUS), 2020; U.S. Department of Commerce / Bureau of Economic Analysis / Regional Economic Accounts / Gross Domestic Product by County, 2019; U.S. Census Bureau, American Community Survey (ACS) and U.S. Department of Commerce / Bureau of Economic Analysis / Regional Economic Accounts / Gross Domestic Product by County, 2019.
[81] Turner and others, “Boosting Upward Mobility: Metrics to Inform Local Action Summary.”
[82] Ibid.
[83] Stuart M. Butler, William W. Beach, and Paul L. Winfree, “Pathways to Economic Mobility: Key Indicators” (2008), available at https://www.pewtrusts.org/~/media/legacy/uploadedfiles/wwwpewtrustsorg/reports/economic_mobility/pewempchartbook12pdf (March 24, 2021).
[84] In order of appearance, NACo Research, 2021; NACo Analysis of: U.S. Census Bureau, Population Estimates Program (PEP), 2020; U.S. Bureau of Labor Statistics, Local Area Unemployment Statistics (LAUS), 2020; U.S. Bureau of Labor Statistics, Local Area Unemployment Statistics (LAUS), 2020; U.S. Department of Commerce / Bureau of Economic Analysis / Regional Economic Accounts / Gross Domestic Product by County, 2019; U.S. Census Bureau, American Community Survey (ACS) and U.S. Department of Commerce / Bureau of Economic Analysis / Regional Economic Accounts / Gross Domestic Product by County, 2019.
[85] NACo categorizes counties based on population size. Large counties have more than 500,000 residents, medium-sized counties have between 50,000 and 500,000 residents and small counties have less than 50,000 residents.
[86] NACo Analysis of U.S. Census Bureau – Population Estimates Program (PEP), 2019.
[87] NACo Analysis of U.S. Census Bureau, Small Area Health Insurance Estimates (SAHIE), 2018.
[88] See, for example, Johns Hopkins Bloomberg School of Public Health, “Primary Care Visits Available to Most Uninsured but at a Higher Price” (2015), available at https://www.jhsph.edu/news/news-releases/2015/primary-care-visits-available-to-most-uninsured-but-at-a-high-price.html (December 9, 2020).
[89] Pinellas County Human Services, “Pinellas County Health Program” (n.d.), available at http://www.pinellascounty.org/humanservices/healthprogram.htm (March 26, 2021).
[90] Ibid.
[91] Florida Association of Counties, “Charter County Information” (n.d.), available at https://www.fl-counties.com/charter-county-information (March 26, 2021).
[92] Sellers and Byers, “County Authority: A State-by-State Report.”
[93] Ibid.
[94] Pinellas County, “COVID-19 Spending Report” (2021), available at https://covid19.pinellascounty.org/covid-19-spending-report/ (March 26, 2021).
[95] NACo Analysis of U.S. Census Bureau – Census of Individual Governments: Finance Data, 2017.
[96] Ibid.
[97] The Pew Charitable Trusts, “Economic Mobility of the States” (2012).
[98] Chetty and others, “Where is the Land of Opportunity?” Commuting zones are aggregations of counties similar to metropolitan statistical areas but which include rural areas and cover the entire nation.
[99] Ibid.
[100] Ibid.
[101] Raj Chetty, Nathaniel Hendren, and Lawrence F. Katz, “The Effects of Exposure to Better Neighborhoods on Children: New Evidence from the Moving to Opportunity Experiment,” American Economic Review 106 (4) (2016): 855–902.
[102] Ibid.
[103] Chetty and Hendren, “The Impacts of Neighborhoods on Intergenerational Mobility I.”
[104] Rodney Andrews and others, “Location Matters: Historical Racial Segregation and Intergenerational Mobility,” Economics Letters 158 (2017): 67–72.
[105] Sean Rusnak, “How an Insufficient Public Transportation System Decelerates Economic Mobility” (2019), available at https://www.instituteforchildsuccess.org/insufficient-public-transportation-decelerates-economic-mobility/ (March 26, 2021).
[106] Ibid.
[107] Ibid.
[108] In order of appearance, NACo Research, 2021; NACo Analysis of: U.S. Census Bureau, Population Estimates Program (PEP), 2020; U.S. Bureau of Labor Statistics, Local Area Unemployment Statistics (LAUS), 2020; U.S. Bureau of Labor Statistics, Local Area Unemployment Statistics (LAUS), 2020; U.S. Department of Commerce / Bureau of Economic Analysis / Regional Economic Accounts / Gross Domestic Product by County, 2019; U.S. Census Bureau, American Community Survey (ACS) and U.S. Department of Commerce / Bureau of Economic Analysis / Regional Economic Accounts / Gross Domestic Product by County, 2019.
[109] NACo Analysis of U.S. Census Bureau, Population Estimates Program (PEP), 2019.
[110] Margery Austin Turner and others, “Boosting Upward Mobility: Metrics to Inform Local Action” (Washington D.C.: Urban Institute, 2020).
[111] Ibid.
[112] In order of appearance, NACo Research, 2021; NACo Analysis of: U.S. Census Bureau, Population Estimates Program (PEP), 2020; U.S. Bureau of Labor Statistics, Local Area Unemployment Statistics (LAUS), 2020; U.S. Bureau of Labor Statistics, Local Area Unemployment Statistics (LAUS), 2020; U.S. Department of Commerce / Bureau of Economic Analysis / Regional Economic Accounts / Gross Domestic Product by County, 2019; U.S. Census Bureau, American Community Survey (ACS) and U.S. Department of Commerce / Bureau of Economic Analysis / Regional Economic Accounts / Gross Domestic Product by County, 2019.
[113] NACo Analysis of U.S. Census Bureau - Population Estimates Program (PEP), 2019.
[114] Ibid.
[115] Virginia’s Legislative Information System, “Virginia Law,” available at https://law.lis.virginia.gov/vacode/15.2-2223/ (March 31, 2021).
[116] Ibid.
[117] Loudoun County, “Loudoun County 2019 Countywide Transportation Plan” (2019), available at https://www.loudoun.gov/DocumentCenter/View/152287/CTP---Combined-with-small-maps-bookmarked (March 26, 2021).
[118] Ibid.
[119] Ibid.
[120] Ibid.
[121] In order of appearance, NACo Research, 2021; NACo Analysis of: U.S. Census Bureau, Population Estimates Program (PEP), 2020; U.S. Bureau of Labor Statistics, Local Area Unemployment Statistics (LAUS), 2020; U.S. Bureau of Labor Statistics, Local Area Unemployment Statistics (LAUS), 2020; U.S. Department of Commerce / Bureau of Economic Analysis / Regional Economic Accounts / Gross Domestic Product by County, 2019; U.S. Census Bureau, American Community Survey (ACS) and U.S. Department of Commerce / Bureau of Economic Analysis / Regional Economic Accounts / Gross Domestic Product by County, 2019.
[122] NACo Analysis of U.S. Census Bureau - Population Estimates Program (PEP), 2019. NACo categorizes counties based on population size. Large counties have more than 500,000 residents, medium-sized counties have between 50,000 and 500,000 residents and small counties have less than 50,000 residents.
[123] In order of appearance, NACo Research, 2021; NACo Analysis of: U.S. Census Bureau, Population Estimates Program (PEP), 2020; U.S. Bureau of Labor Statistics, Local Area Unemployment Statistics (LAUS), 2020; U.S. Bureau of Labor Statistics, Local Area Unemployment Statistics (LAUS), 2020; U.S. Department of Commerce / Bureau of Economic Analysis / Regional Economic Accounts / Gross Domestic Product by County, 2019; U.S. Census Bureau, American Community Survey (ACS) and U.S. Department of Commerce / Bureau of Economic Analysis / Regional Economic Accounts / Gross Domestic Product by County, 2019.
[124] Choose Erie, “Regional Chamber and Growth Partnership” (n.d.), available at www.chooseerie.com (March 26, 2021).
[125] Ibid.
[126] In order of appearance, NACo Research, 2021; NACo Analysis of: U.S. Census Bureau, Population Estimates Program (PEP), 2020; U.S. Bureau of Labor Statistics, Local Area Unemployment Statistics (LAUS), 2020; U.S. Bureau of Labor Statistics, Local Area Unemployment Statistics (LAUS), 2020; U.S. Department of Commerce / Bureau of Economic Analysis / Regional Economic Accounts / Gross Domestic Product by County, 2019; U.S. Census Bureau, American Community Survey (ACS) and U.S. Department of Commerce / Bureau of Economic Analysis / Regional Economic Accounts / Gross Domestic Product by County, 2019.
[127] Hennepin County, “Transit Oriented Development” (n.d.), available at https://www.hennepin.us/sitecore/content/economic-development/programs/transit-oriented-development (March 26, 2021).
[128] Ibid.
[129] Ibid.
[130] NACo Analysis of: Bureau of Justice Statistics, Census of Jail Facilities Data, 2013; Census of Governments Data, 2017; U.S. Census Bureau – Census of Individual Governments: Finance Data, 2017.
[131] NACo Analysis of U.S. Census Bureau – Census of Individual Governments: Finance Data, 2017.
[132] Lauren Tara LaCapra, “What going to jail does to your finances” Splinter News, July 9, 2015, available at https://splinternews.com/what-going-to-jail-does-to-your-finances-1793850560 (March 26, 2021).
[133] https://www.pewtrusts.org/~/media/legacy/uploadedfiles/pcs_assets/2010/collateralcosts1pdf.pdf
[134] Amy Sheppard and Rosemary Ricciardelli, “Employment After Prison: Navigating Conditions of Precarity and Stigma” (Memorial University of Newfoundland, Canada, 2020).
[135] Chetty and others, “Race and Economic Opportunity in the United States: An Intergenerational Perspective.”
[136] In order of appearance, NACo Research, 2021; NACo Analysis of: U.S. Census Bureau, Population Estimates Program (PEP), 2020; U.S. Bureau of Labor Statistics, Local Area Unemployment Statistics (LAUS), 2020; U.S. Bureau of Labor Statistics, Local Area Unemployment Statistics (LAUS), 2020; U.S. Department of Commerce / Bureau of Economic Analysis / Regional Economic Accounts / Gross Domestic Product by County, 2019; U.S. Census Bureau, American Community Survey (ACS) and U.S. Department of Commerce / Bureau of Economic Analysis / Regional Economic Accounts / Gross Domestic Product by County, 2019.
[137] Volunteers of America Oregon, “Reentry Enhancement Coordination” (n.d.), available at https://www.voaor.org/find-services/reentry-and-transition/reentry-enhancement-coordination/ (March 26, 2021).
[138] State of Oregon Criminal Justice Commission, “Offender Reentry Programs Preliminary Evaluation” (2011), available at https://www.oregon.gov/cjc/CJC%20Document%20Library/reentry_eval_final.pdf (March 26, 2021).
[139] Ibid.
[140] State of Oregon Criminal Justice Commission, “Short Term Transitional Leave Program in Oregon” (2019), available at https://www.oregon.gov/cjc/CJC%20Document%20Library/2019STTLReport.pdf (March 26, 2021).
[141] Worksource Oregon Employment Department, SE Works NewStart Reentry Resource Center, available at https://seworks.org/newstart/.
[142] Amy L. Solomon and others, “From Prison to Work: The Employment Dimensions of Prisoner Reentry - A Report of the Reentry Roundtable” (Washington, D.C.: Urban Institute, 2004).
[143] In order of appearance, NACo Research, 2021; NACo Analysis of: U.S. Census Bureau, Population Estimates Program (PEP), 2020; U.S. Bureau of Labor Statistics, Local Area Unemployment Statistics (LAUS), 2020; U.S. Bureau of Labor Statistics, Local Area Unemployment Statistics (LAUS), 2020; U.S. Department of Commerce / Bureau of Economic Analysis / Regional Economic Accounts / Gross Domestic Product by County, 2019; U.S. Census Bureau, American Community Survey (ACS) and U.S. Department of Commerce / Bureau of Economic Analysis / Regional Economic Accounts / Gross Domestic Product by County, 2019.
[144] See the Council of State Governments Justice Center, “After the Sentence, More Consequences: A National Report of Barriers to Work” (2021), available at https://csgjusticecenter.org/publications/after-the-sentence-more-consequences/ (March 26, 2021); The Council of State Governments Justice Center, “Laying the Groundwork: How States Can Improve Access to Continued Education for People in the Criminal Justice System” (2020), available at https://csgjusticecenter.org/publications/laying-the-groundwork/ (March 26, 2021) and Mark T. Berg and Beth M. Huebner, “Reentry and the Ties that Bind: An Examination of Social Ties, Employment, and Recidivism,” Justice Quarterly 28 (2) (2011): 382-410.
[145] The Council of State Governments Justice Center, “The Second Chance Act: Background” (2018), available at https://csgjusticecenter.org/wp-content/uploads/2020/02/July-2018_SCA_factsheet.pdf (March 26, 2021).
[146] Tara O'Neill Hayes, “The Economic Costs of the U.S. Criminal Justice System” (Washington, D.C.: American Action Forum, 2020).
[147] Pew Research Center, “Internet/Broadband Fact Sheet” (2019), available at https://www.pewresearch.org/internet/fact-sheet/internet-broadband/ (March 26, 2021).
[148] Ibid.
[149] National Association of Counties, “NACo Broadband Task Force” (n.d.), available at https://www.naco.org/naco-broadband-task-force (March 26, 2021).
[150] In order of appearance, NACo Research, 2021; NACo Analysis of: U.S. Census Bureau, Population Estimates Program (PEP), 2020; U.S. Bureau of Labor Statistics, Local Area Unemployment Statistics (LAUS), 2020; U.S. Bureau of Labor Statistics, Local Area Unemployment Statistics (LAUS), 2020; U.S. Department of Commerce / Bureau of Economic Analysis / Regional Economic Accounts / Gross Domestic Product by County, 2019; U.S. Census Bureau, American Community Survey (ACS) and U.S. Department of Commerce / Bureau of Economic Analysis / Regional Economic Accounts / Gross Domestic Product by County, 2019.
[151] NACo Analysis of U.S. Census Bureau, American Community Survey (ACS) Five-Year Estimates.
[152] Arthur Scott, “Understanding the True State of Connectivity in America” (Washington, D.C.: National Association of Counties, 2020).
[153] Northwest Commission, “Community Technology Action Plan” (2017), available at https://broadband.eriecountypa.gov/pdf/NWPA-Connected-Plan-Final.pdf (March 26, 2021).
[154] Ibid.
[155] Erie County Broadband Initiative, “Mission” (n.d.), available at https://broadband.eriecountypa.gov/#sectionMission (March 26, 2021).
[156] In order of appearance, NACo Research, 2021; NACo Analysis of: U.S. Census Bureau, Population Estimates Program (PEP), 2020; U.S. Bureau of Labor Statistics, Local Area Unemployment Statistics (LAUS), 2020; U.S. Bureau of Labor Statistics, Local Area Unemployment Statistics (LAUS), 2020; U.S. Department of Commerce / Bureau of Economic Analysis / Regional Economic Accounts / Gross Domestic Product by County, 2019; U.S. Census Bureau, American Community Survey (ACS) and U.S. Department of Commerce / Bureau of Economic Analysis / Regional Economic Accounts / Gross Domestic Product by County, 2019.
[157] Columbia Telecommunications Corporation, “Fiber-to-the-Premises Feasibility Study: Prepared for Multnomah County, Oregon” (2020), available at https://multco.us/file/92615/download (March 26, 2021).
[158] Ibid.
[159] Ibid.
[160] First National Bank of Omaha, “Study: 53% of U.S. Adults Don’t Have Emergency Fund” (2020), available at https://www.fnbo.com/insights/2020/newsroom/fnbo-releases-2020-financial-planning-survey/index.html (March 26, 2021).
[161] Shawn M. Carter, “Here’s How Many More Americans Are Living Paycheck-to-Paycheck since the Covid Pandemic Started” (2020), available at https://grow.acorns.com/americans-living-paycheck-to-paycheck-during-covid/ (March 26, 2021).
[162] Anne Tergesen and Heather Gillers, “U.S. Retirement Crisis Hits Black Americans Hard” The Wall Street Journal, February 22, 2021, available at https://www.wsj.com/articles/u-s-retirement-crisis-hits-black-americans-hard-11613989981?mod=hp_lead_pos5 (March 26, 2021).
[163] Karen Kavanaugh, “A Decade After Economic Crisis, Many Families Continue to Struggle” (2018), available at https://www.pewtrusts.org/en/research-and-analysis/articles/2018/10/09/a-decade-after-economic-crisis-many-families-continue-to-struggle (March 26, 2021).
[164] The Aspen Institute, “The State of Financial Security 2020: A Framework for Recovery and Resilience” (2020).
[165] Grawe, “Education and Economic Mobility.”
[166] Kaisa Snellman and others, “The Engagement Gap: Social Mobility and Extracurricular Participation among American Youth” The ANNALS of the American Academy of Political and Social Science, 657 (1) (2014): 194-207.
[167] The Aspen Institute, “The State of Financial Security 2020: A Framework for Recovery and Resilience.”
[168] In order of appearance, NACo Research, 2021; NACo Analysis of: U.S. Census Bureau, Population Estimates Program (PEP), 2020; U.S. Bureau of Labor Statistics, Local Area Unemployment Statistics (LAUS), 2020; U.S. Bureau of Labor Statistics, Local Area Unemployment Statistics (LAUS), 2020; U.S. Department of Commerce / Bureau of Economic Analysis / Regional Economic Accounts / Gross Domestic Product by County, 2019; U.S. Census Bureau, American Community Survey (ACS) and U.S. Department of Commerce / Bureau of Economic Analysis / Regional Economic Accounts / Gross Domestic Product by County, 2019.
[169] NACo Analysis of U.S. Census Bureau - American Community Survey (ACS) Five-Year Estimates, 2014–2018 (Table B19049).
[170] The Aspen Institute, “State 2Gen Model: Maryland as a Case Study for Policymakers” (2020).
[171] Foundation for Child Development, “History” (n.d.), available at https://www.fcd-us.org/about-us/history/ (March 26, 2021).
[172] Garrett County Community Action Committee, “2-Generation (2-G)” (n.d.), available at https://www.garrettcac.org/index.php/early-childhood-dev/2-generation-2g (March 26, 2021).
[173] Ibid.
[174] The Aspen Institute, “State 2Gen Model: Maryland as a Case Study for Policymakers.”
[175] Garrett County Community Action Committee, “2-G Success Stories” (n.d.), available at https://www.garrettcac.org/index.php/early-childhood-dev/2-generation-2g/124-family-development/2-generation-2g/372-2-g-success (March 26, 2021).
[176] The Aspen Institute, “State 2Gen Model: Maryland as a Case Study for Policymakers.”
[177] In order of appearance, NACo Research, 2021; NACo Analysis of: U.S. Census Bureau, Population Estimates Program (PEP), 2020; U.S. Bureau of Labor Statistics, Local Area Unemployment Statistics (LAUS), 2020; U.S. Bureau of Labor Statistics, Local Area Unemployment Statistics (LAUS), 2020; U.S. Department of Commerce / Bureau of Economic Analysis / Regional Economic Accounts / Gross Domestic Product by County, 2019; U.S. Census Bureau, American Community Survey (ACS) and U.S. Department of Commerce / Bureau of Economic Analysis / Regional Economic Accounts / Gross Domestic Product by County, 2019.
[178] Bank on South Alabama, available at bankonsouthalabama.org (March 26, 2021).
[179] Ibid.
[180] Federal Reserve, “Report on the Economic Well-Being of U.S. Households in 2018 - May 2019” (Board of Governors of the Federal Reserve System, 2019).
[181] Connect, “Unbanked vs. Underbanked: Who They Are and How They Differ” (2020), available at https://www.microbiltconnect.com/article/Unbanked-vs-Underbanked-Who-they-are-and-how-they-differ (March 26, 2021).
[182] Ibid.
[183] Mobile County, “HOME Investments Partnership” (n.d.), available at https://www.mobilecountyal.gov/grants/assisted-home-program/ (March 26, 2021).
[184] Ibid.
[185] Ibid.
[186] Ibid.
[187] Ibid.
[188] Ibid.
[189] The Aspen Institute, “The State of Financial Security 2020: A Framework for Recovery and Resilience.”
[190] In order of appearance, NACo Research, 2021; NACo Analysis of: U.S. Census Bureau, Population Estimates Program (PEP), 2020; U.S. Bureau of Labor Statistics, Local Area Unemployment Statistics (LAUS), 2020; U.S. Bureau of Labor Statistics, Local Area Unemployment Statistics (LAUS), 2020; U.S. Department of Commerce / Bureau of Economic Analysis / Regional Economic Accounts / Gross Domestic Product by County, 2019; U.S. Census Bureau, American Community Survey (ACS) and U.S. Department of Commerce / Bureau of Economic Analysis / Regional Economic Accounts / Gross Domestic Product by County, 2019.
[191] NACo Analysis of National Center for Economic Statistics (NCES) - Common Core Data (CCD), Elementary and Secondary Information System (ELSi), 2017.
[192] Bernalillo County Community Services, “What is a Community School?” (n.d.), available at https://www.bernco.gov/community-services/what-is-a-community-school-.aspx (March 26, 2021).
[193] Bernalillo County Community Services, “ABC Community School Partnership Fact Sheet” (n.d.), available at https://www.bernco.gov/community-services/news.aspx?f50e29bf166542cbb6963e258ca152b9blogPostId=047b67e795da42b882b38591ffb8d997#/BlogContent (March 26, 2021).
[194] Coalition for Community Schools, “School Details” (n.d.), available at http://www.communityschools.org/mapdetails.aspx?iid=26 (March 26, 2021).
[195] Ibid.
[196] American Federation of Teachers, “Community Schools: Case Studies of What Works” (n.d.), available at https://www.bernco.gov/uploads/files/Community%20Schools%20AFT.pdf (March 26, 2021).
[197] Bernalillo County Community Services, “New Report Shows Deep Impact of ABC Community School Partnership” (2018), available at https://www.bernco.gov/community-services/news.aspx?f50e29bf166542cbb6963e258ca152b9blogPostId=e541ee305145414699e7f24c50cc7b19#/BlogContent (March 26, 2021).
[198] Ibid.
[199] Bernalillo County Community Services, “ABC Community School Partnership Fact Sheet.”
[200] Coalition for Community Schools, “Coalition for Community Schools, “School Details.”

House Passes Historic Outdoor Recreation Legislation
The U.S. House passed the bipartisan EXPLORE Act (H.R.6492) on April 9 to boost outdoor recreation opportunities on public lands and aid local economies


Counties offer a second chance after incarceration
From job fairs and housing programs to educational opportunities, counties offer a second chance after incarceration.

County shines light on property deed history of racially restrictive covenants
The Durham County, N.C. Register of Deeds is using public records information and archival documentation to educate county residents on racially restrictive covenants in property deeds and how their impact can still be felt today.

Coal counties search for a crystal ball to their futures
The transition from a coal-reliant community is not just an economic adjustment, it's a cultural transformation.

Fixing titles opens doors for Black homeowners
Washtenaw County, Mich. has returned $3.3 million in real estate to families who were forced by segregation to rely on complex legal strategies to buy homes.