Local Area Unemployment Statistics: An Economic Analysis of COVID-19


|
TOP TEN COUNTIES WITH AUGUST UNEMPLOYMENT
|
TOP TEN COUNTIES WITH AUGUST UNEMPLOYMENT
|
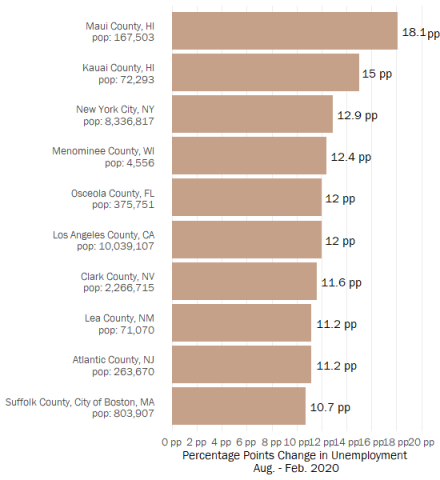
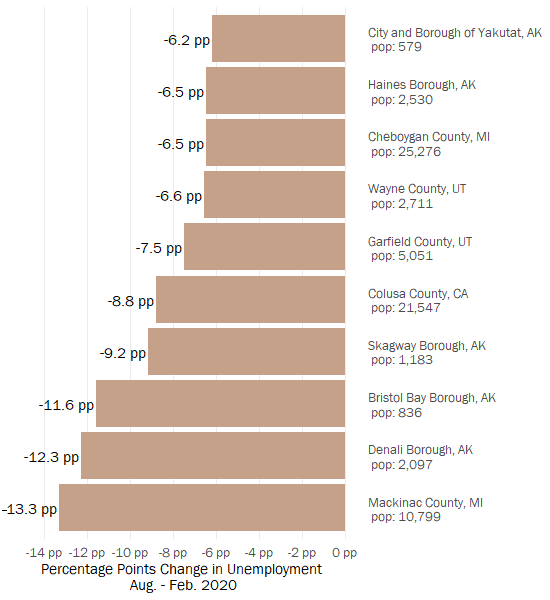
Source: NACo Analysis of Bureau of Labor Statistics Local Area Unemployment Statistics; August Figures are Preliminary
Because counties vary in economic, geographic and demographic characteristics, it is unsurprising to see large variances in how the coronavirus recession is impacting the labor market among counties. In August, the county with unemployment levels furthest from pre-peak unemployment was Maui County, Hawaii, with an unemployment rate 18.1 percentage points higher than its February level. This rate is contrasted with a 13.3 percentage point decrease between August and February unemployment rates in Mackinac County, Mich. which experienced unemployment rates of only 4.6 percent in August. There may be many explanations for this variation, such as differences in government policy, labor force migration patterns and shifts, education levels and other economic characteristics. Despite these potential explanations, the underlying conclusion is such that local economies are unique to each county and thus national trends do not always represent the situation on the ground.
This analysis seeks to illuminate the impacts COVID-19 has had on county economies thus far during the pandemic, measured by local area unemployment statistics and unemployment insurance claims. Counties were grouped based on selected economic trends in February 2020 and these benchmarks were followed month-by-month since the beginning of 2020 to try and understand how county economies are responding and why.
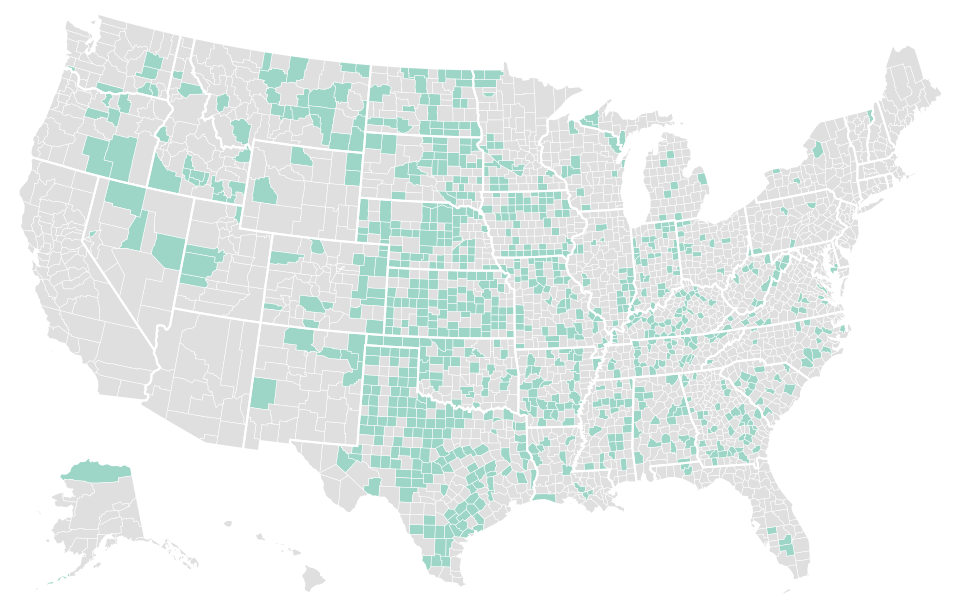
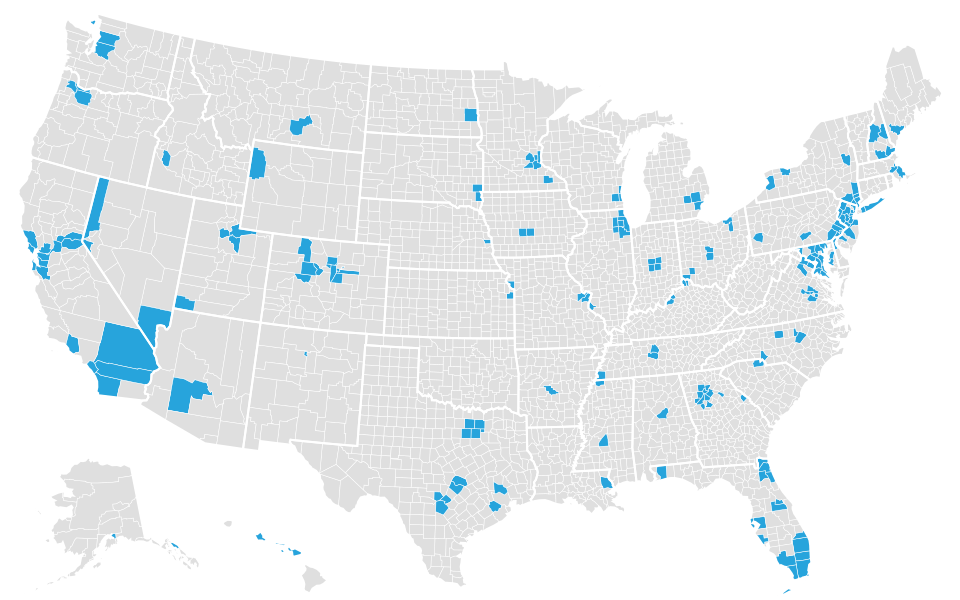
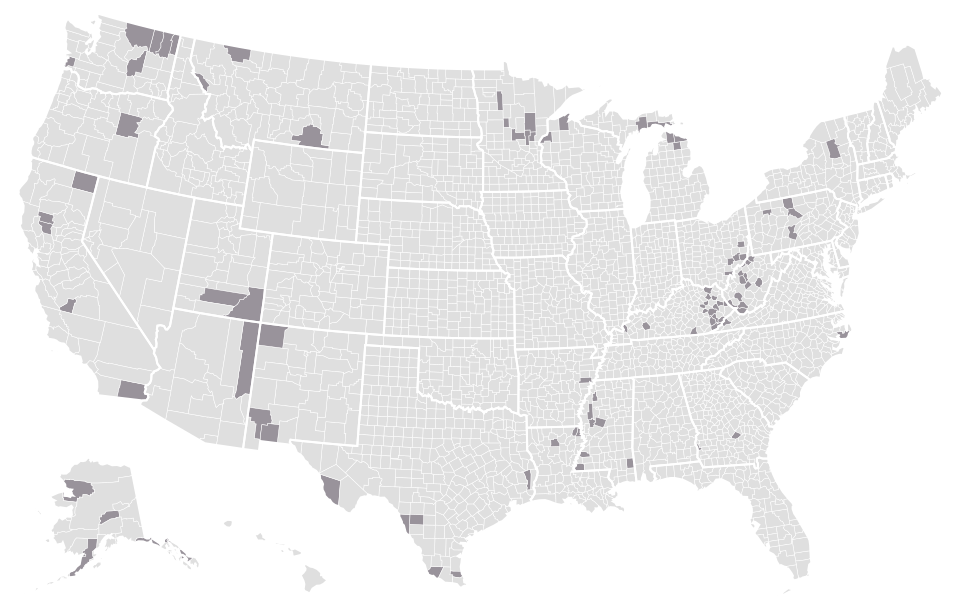
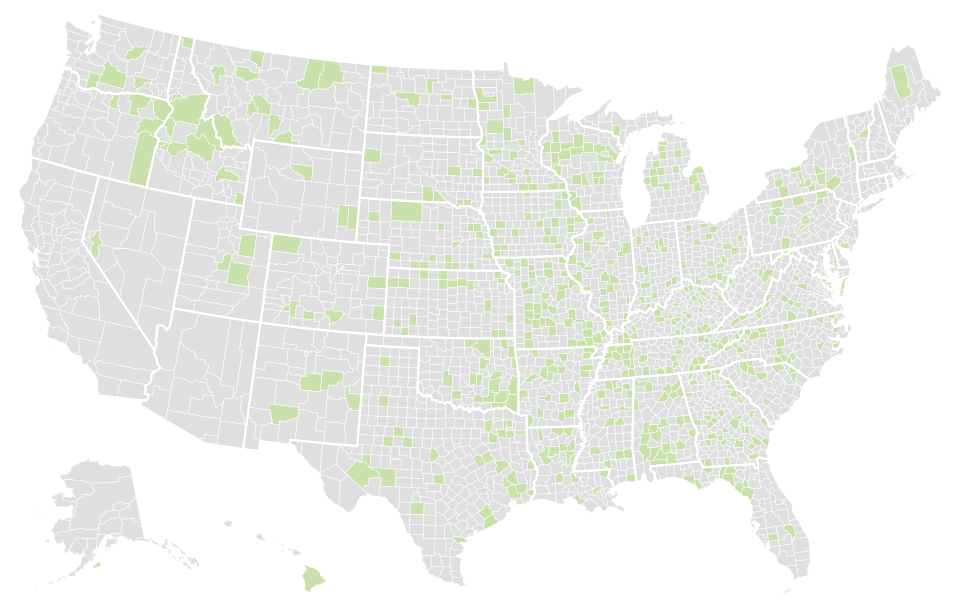
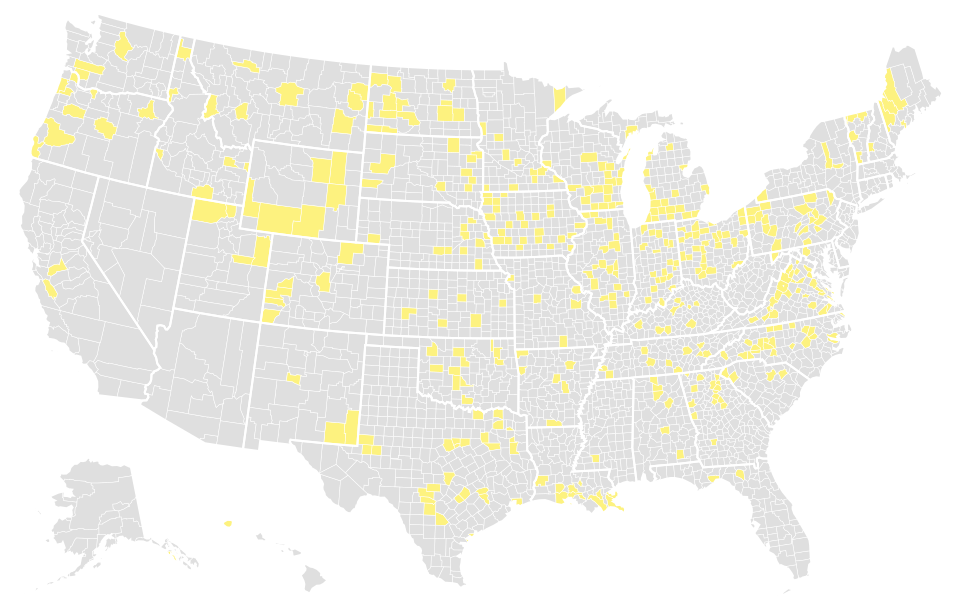
COUNTY ECONOMIC PATTERNS, STRATIFIED
Groupings of County Economies With Similar Features, as of February 2020
View Map in Full Screen
|
Group A: Balanced, diverse economies |
|
|
Group B: Government-driven economies |
|
|
Group C: High income economies |
|
|
Group D: Small counties with high government spending |
|
|
Group E: Unstable economies prior to COVID-19 |
|
|
Group F: Nominal mid-sized counties |
|
|
Group G: Export-reliant economies |
|
|
Group H: Three mega-economies |
|
|
Group I: Goods-producing economies |
|
COUNTIES WITH DIVERSIFIED ECONOMIES APPEAR TO HAVE FARED BETTER THUS FAR IN THE RECESSION
Local Area Unemployment Statistics, Aggregated by Group
Click once on a legend element to remove or add traces, double click to isolate a trace.
Source: NACo Analysis of Bureau of Labor Statistics Local Area Unemployment Statistics; August Figures are Preliminary
Counties with diversified economies have thus far fared better throughout the crisis than those dominated by a single sector. Groups of economies that appear reliant on just one or two factors appear to be less resilient to the economic changes occurring thus far in the coronavirus recession. If the majority of the jobs and economic output of a county are placed into one sector, then that economy would be proportionally susceptible to disruptions causing staggering impacts to these economies. However, a more diversified portfolio of economic features seems to offer counties more stabilization when market impacts, such as those experienced from business closure and stay-at-home orders issued during the coronavirus recession, do occur. Though all aspects of the economy experienced shifts in footing, it appears that the groups which are more mid-range in the economic indicators, especially those with more even distributions of jobs between goods, services and government have been able to bounce back at a quicker pace.
UNEMPLOYMENT RATES FOR COUNTIES IN GROUP H
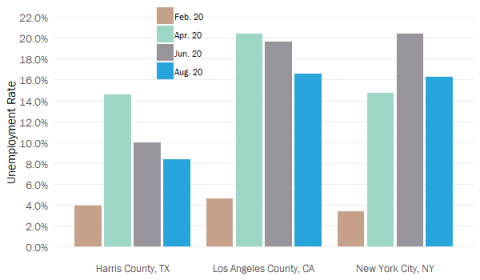
Source: NACo Analysis of Bureau of Labor Statistics Local Area Unemployment Statistics; August Figures are Preliminary |
Group H, the agglomeration of the three mega-economies, experienced drastic increases in the collective unemployment rate — increasing 14.5 percentage points between February and May. The group has experienced slow recovery in June, July and August — likely driven by industries in service-based sectors. Eighty-one (81) percent of the jobs in the labor market in Group H are service-driven. Two of the hardest-hit jurisdictions during the COVID-19 pandemic are within this group, Los Angeles County, Calif. and New York City, N.Y. The spike in April and May coincides with efforts to reduce the spread of COVID-19 within these areas, which are likely contributing to the group's slow recovery.
Group C, the group with the highest median household income, follows a similar pattern starting with the lowest collective unemployment rate of all nine groups and becoming the group with the third-highest unemployment rate in August due to an increase in April; likely the result of initial impacts of the pandemic as many counties in Group C are located on the eastern and western coasts, including areas which were or were nearby the initial epicenters of the COVID-19 virus in the United States. The two largest industries within Group C are Health Care and Social Assistance, with 11.1 percent of all jobs, and Retail Trade with 9.1 percent of all jobs. With hospitals limiting operations to focus on treating COVID-19 patients and retail businesses suspending operations or closing to help ensure public health, it is of little wonder why high labor force impacts were experienced. The steady unemployment decline likely results from careful and cautious reopening plans set forth by state and local governments within Group C, however unemployment levels remain significantly higher than pre-pandemic levels for this group.
When compared to others, Group E began with a high collective unemployment rate, thus implying a largely unstable situation before the recession began. Despite experiencing a spike in unemployment rates in April, the economic impacts were less pronounced. In this group, the unemployment rate increased by nearly eight percentage points between February and April. By July, Group E is only 1.65 percentage points away from February levels. The spike of unemployment in April may indicate an instant reaction to the developing economic recession, while the initial decrease indicates some settling of the economy. However, economic recovery will likely be a long road for counties in this group as the unemployment rate may have reached a plateau in its decline in June and July, underscoring the impacts this recession will leave on already struggling communities.
Group A, notable for mostly balanced and diverse economies, experienced one of the smallest spikes in Unemployment between February to April — increasing only 8.6 percentage points. Additionally, Group A has seen the second-fastest recovery of all groups up to this point, now only 2.05 percentage points higher than pre-peak levels in February. The diversification of the job market within this community is likely the top driver of its economic success thus far. Top industries by share of employment in Group A include Manufacturing (15.6 percent), State and Local Government (12.8 percent), Farm Employment (9.4 percent), Retail Trade (9 percent) and Construction (6.1 percent). With more business in different sectors, it is probably easier to regain the traction that the economy had before the pandemic, and there is less competition for the smaller amount of resources and aid available throughout the recession. Like other groups, Group A experienced a spike in unemployment rates in April, likely due to efforts to mitigate the ongoing public health crisis. Since April, it has had significant recovery as employers and government leaders worked to reopen business safely.
Most of the other groups follow similar patterns to national trends, starting with low unemployment rates in January and February followed by a rise in unemployment beginning in March, then peaking in April. Following the peak is a slow and steady recovery that, in some cases, levels off or slightly increases in July, with all groups decreasing in August.
ECONOMIES RELIANT ON THE GOVERNMENT SECTOR HAVE BEEN HIT HARD BY MEASURE OF INITIAL UNEMPLOYMENT INSURANCE CLAIMS
Initial Unemployment Claims, Aggregated by Group
Click once on a legend element to remove or add traces, double click to isolate a trace.
Source: NACo Analysis of Opportunity Insights Economic Tracker Unemployment Insurance Claims; Data Contains Missing Values
Similar trends are seen in initial unemployment insurance claims originating from counties within each group. Group B provides insight into government and government enterprise workers as this grouping is the only one to have the highest distribution of the median share of jobs in the government and government enterprises sector, including a total share of 10.9 percent of jobs in local government. Group B has experienced a slow recovery after the peak in initial unemployment insurance claims firings thus far, remaining near the top of the pack despite not having one of the highest peaks. This indicates continued residual impacts to these counties' economies, likely stemming from a loss in revenue. Group B also saw decreases in initial claims lasting until the end of May, with an increase again starting in June. The same trend is mirrored in the unemployment levels for Group B.
Groups A and I, located mostly in the Midwest and the South, peaked first during the week ending on March 28th. Since the peak, Group A has remained the group with the most initial unemployment insurance claims throughout the following months while Group I slowly makes its way to one of the lowest groups for these claims by mid to late August. As with unemployment rates, it is likely the case that the diversity of the economy in Groups A and I have helped to reduce the competition between businesses for much-needed aid, thus allowing these communities to have more resiliency to economic impacts.
Groups F and G experienced spikes in initial unemployment insurance claims at the beginning of the first week of April, likely due to the high concentration on the west coast and in the northeast, which were hit hard by the pandemic in late March and early April. Group G became the lowest of all groups from June to early August, while Group F remained in the middle position throughout the same months.
All other groups peaked during the week ending April 11th. Group H experienced a slowdown in initial claims in the two weeks following the April 11 peak that can potentially be attributed to the federal government CARES act implementation providing Americans with stimulus checks, expanded unemployment insurance funding and businesses payroll protection program funding for businesses.
Groups with mostly service-driven industries jobs experienced the most significant increases in initial unemployment insurance claims, such as Group C. In contrast, those reliant on goods-producing industry jobs experienced initial impacts but have been faster to recover in the following months. These impacts might be a result of service-producing industries being more dominant in counties with a larger population, while goods-producing industries dominate counties with smaller communities.1 Counties with larger populations may have had more public health concerns related to the COVID-19 pandemic — due to higher population densities — and thus may have different economic impacts than counties with smaller populations.
Geopolitical tensions and the ongoing pandemic have also impacted counties reliant on international exports. Groups A, G and I have the largest median exports in proportion to median GDP. Despite experiencing spikes during different times, all three groups experienced peak initial unemployment insurance claims in all groups' top ranges. Notwithstanding these spikes, counties in these three groups quickly appeared to begin the recovery process with decreases in the following months. Similar trends are seen for these pairings of groups within the unemployment data suggesting an initial shock to the exporting industries, followed by increased demand for exporting industries to create more goods for domestic consumption as the markets and availability of imports from other countries dwindled due to public health concerns related to spreading the virus by importing goods from other countries and subsequent impacts on import-dependent supply chains.
CORONAVIRUS RELIEF FUND RECIPIENTS HAVE SEEN POSITIVE IMPROVEMENT SINCE INITIAL DISBURSEMENTS BEGAN
Unemployment Rates for Counties Which Received Direct CARES Payments, Aggregated by Census Region
Click once on a legend element to remove or add traces, double click to isolate a trace.
Source: NACo Analysis of Bureau of Labor Statistics Local Area Unemployment Statistics; August Figures are Preliminary
With the passing of the CARES act in March, over $17B in relief funds were distributed directly to 119 eligible counties. This funding has helped counties provide essential services to communities during this unprecedented crisis. Policies implemented by local and state government officials, along with the efforts of frontline workers and the influx of direct CARES act funding seem to have had a positive impact on the speed of jobs recovery in these 116 counties. After the distribution of the funding, many of these counties began to have drastic reductions in unemployment rates, though some appear to have had a slight increase, possibly attributed to a lag in returns on the CARES investment. Importantly, CARES act funding has allowed counties to retain staff that otherwise may have been furloughed or laid off in an effort to mitigate budget concerns. According to research from the Harvard Business School, CARES act funding suppressed government employee layoffs in late April.2 It is imperative that counties have adequate staffing levels to serve local communities as the recovery effort progresses. Many counties across the U.S. are currently receiving CARES act investments by way of distribution through the state; however, the counties that have received direct aid from the treasury department appear to have had improvements – potentially as a direct result from this influx of dollars. Counties are relying on additional direct and flexible dollars to continue serving the needs of local communities.
CONCLUSION
Counties are working towards full economic recovery while sustaining vibrant, resilient and healthy communities. Benchmarks such as unemployment rates and initial unemployment insurance claims help guide local leaders as decision-makers create and amend policies. Though often indicative of local challenges, national trends do not accurately illustrate the on-the-ground situation in local economies. Throughout the Great Recession, it was found that regions dependent on service-producing industries fared better than those dependent on goods-producing industries as demand for services was determined to be less cyclical while still yielding lower growth during economic downturns.3 However, as noted in this analysis, it appears that local economies dependent on service-producing industries may bear the brunt of the economic recession this time around in part due to the typical geolocation within larger communities, most of which have had to undertake more extreme measures to slow the spread of the coronavirus.4 This note underscores the significant differences of the COVID-19 recession in contrast to any other recession in recent history. With unprecedented levels of unemployment and initial unemployment insurance claims, record-breaking decreases in the stock market and many other unparalleled challenges facing communities, local leaders remain on the frontlines of fostering economic recovery and public health and safety. Direct CARES act payments to counties have been important to ensure counties have staffing levels proportional to community needs. Without direct, flexible federal funding, counties face an uphill battle in the process of rebuilding local economies.
METHODOLOGY AND GROUP OVERVIEW
To create the nine distinct clusters in the analysis, the authors tested many frameworks; the Hierarchical model using Ward linkage criteria to build nested clusters of counties presented the most viable results.5 This method minimizes the sum of squared differences, or the variances, within all clusters. Before clustering, the data were scaled using the Maximum Absolute Value.6 The indicators used are as follows:
- County expenditures measure the county investment level within the community
- International exports measure how dependent the economy is on exporting goods and services globally
- Gross Domestic Product (GDP) measures the overall economic output of the economy
- Median household income measures the affluence of the individuals within the economy
- Percentage of goods, services and government employment all measure the amount of job within county economies garnered from these sectors
- Goods producing jobs include Manufacturing, Construction, Farming and other occupations that produce tangible goods
- Service producing employment includes Retail Trade, Financial Services, Business Enterprises and other occupations that produce primarily intangible value to customers
- Government and government enterprises include public sector jobs or civilian jobs contracted by government entities
- February labor force measures the number of workers who have the potential and desire to work within the economy
- February unemployment rate measures the reported unemployment level in the county as of February 1, 2020
|
Group A: Balanced, diverse economies |
|
||
|
Group B: Government-driven economies |
|
||
|
Group C: High income economies |
|
||
|
Group D: Small counties with high government spending |
|
||
|
Group E: Unstable economies prior to COVID-19 |
|
||
|
Group F: Nominal mid-sized counties |
|
||
|
Group G: Export-reliant economies |
|
||
|
Group H: Three mega-economies |
|
||
|
Group I: Goods-producing economies |
|


Limitations
Limitations to this analysis include a lack of data focused on the impact government policies relating to business closures and reopening plans may have had on initial unemployment and success in local economic recovery.
ENDNOTES
- Ricardo Aguilar & Teryn Zmuda, National Association of Counties Research Foundation “County Economic Output Trends’s Default Rate” (2020), available at https://www.naco.org/
- Daniel Green & Erik Loualiche, Harvard Business School “State and Local Government Employment in the COVID-19 Crisis” (2020), available at https://www.ssrn.com
- Ricardo Aguilar & Teryn Zmuda, National Association of Counties Research Foundation “County Economic Output Trends’s Default Rate” (2020), available at https://www.naco.org/
- Sickit Learn, Overview of Clustering Methods “Hierarchical Cluster” (2020), available at https://scikit-learn.org
- Sickit Learn, Pre-Processing “MaxAbsScalar” (2020), available at https://scikit-learn.org