How communities are investing American Rescue Plan funds with the Local Government ARPA Investment Tracker
Author

Alan Berube

Christiana McFarland

Upcoming Events
Related News

Key Takeaways
In the 10 months since the passage of the $1.9 trillion American Rescue Plan Act (ARPA), cities and counties have been working to prioritize and execute investing of their portion of the act’s $350 billion in flexible State and Local Fiscal Recovery Fund (SLFRF) dollars. And as recent Treasury Department guidance made clear, local leaders have myriad options to use these resources to address the direct health and economic impacts of the COVID-19 pandemic, as well as to confront the underlying challenges that exacerbated the pandemic’s negative effects on vulnerable individuals, businesses, and communities.
To illuminate the many options at communities’ disposal, we are introducing the Local Government ARPA Investment Tracker, a joint project of Brookings Metro, the National Association of Counties (NACo) and the National League of Cities (NLC). This tool adds to other important efforts to understand local ARPA implementation, including Results for America’s ARP Data and Evidence Dashboard, and the Treasury Department’s analysis of highlights from initial SLFRF reports.
Communities have until 2024 to fully plan for and commit their funds, and until 2026 to spend them. Local governments’ initial SLFRF expenditure reports contain useful roadmaps on where they are heading with ARPA funds; large cities and counties (those with populations of at least 250,000) have also delivered the first in a series of annual plans that outline their intended and actual uses of SLFRF dollars. Together, these reports detail thousands of projects across dozens of eligible expenditure categories and form the data behind the Local Government ARPA Investment Tracker.
The Tracker currently captures recovery plan data from 41 large cities, 104 large counties, and seven consolidated city-counties that listed at least one specific project and associated dollar allocation in their first performance reports. Another 32 large cities and 124 large counties submitted reports, but did not list any planned projects in the “Project Inventory” section of those reports (e.g., Pittsburgh, Jackson County, Mo.). An additional nine large cities and 20 large counties did not submit reports. While the number of cities and counties reflected in the Tracker will grow over time as more information becomes available, those places already included reveal an important baseline for understanding and tracking local ARPA efforts moving forward.
Large cities and counties have planned projects representing about half of their total allocation of flexible dollars
Together, the 152 large cities and counties in our Tracker have set aside funds for more than 2,300 named projects. Those projects collectively represent $18.4 billion in planned spending—a little less than half of the total SLFRF allocation for these cities and counties. Large cities have planned and budgeted a greater share of their funds ($9.5 billion, or 60% of their total allocation) than large counties ($5.7 billion, or roughly 32% of their total allocation).

The Tracker “codes” each project listed in a city or county’s annual Recovery Plan Performance Report at two levels: 1) in one of seven overall spending groups (community aid, economic and workforce development, government operations, housing, infrastructure, public health, and public safety), and 2) in more than 40 spending sub-groups that provide further detail on intended use of funds. For instance, Buffalo, N.Y. listed 26 specific projects in its report. We identified six of these as furthering economic and workforce development; among these are projects to support small businesses, promote workforce readiness, and provide summer employment opportunities to young people.
A significant portion of funding is being used to replace lost revenue
While large cities and counties are planning investments across a host of critical services, supports, and projects, they are dedicating the largest share of their funds to government operations. This category includes government employee wages or hiring, fiscal health recovery, and investment in city facilities, equipment, and IT.
This commitment indicates that in the early stages of the recovery, many cities and counties are first stabilizing operations, balancing budgets, and restoring service levels. We anticipate that as time goes on, the share of SLFRF dollars dedicated to government operations will decline, as stabilization priorities give way to larger-scale, longer-term efforts.
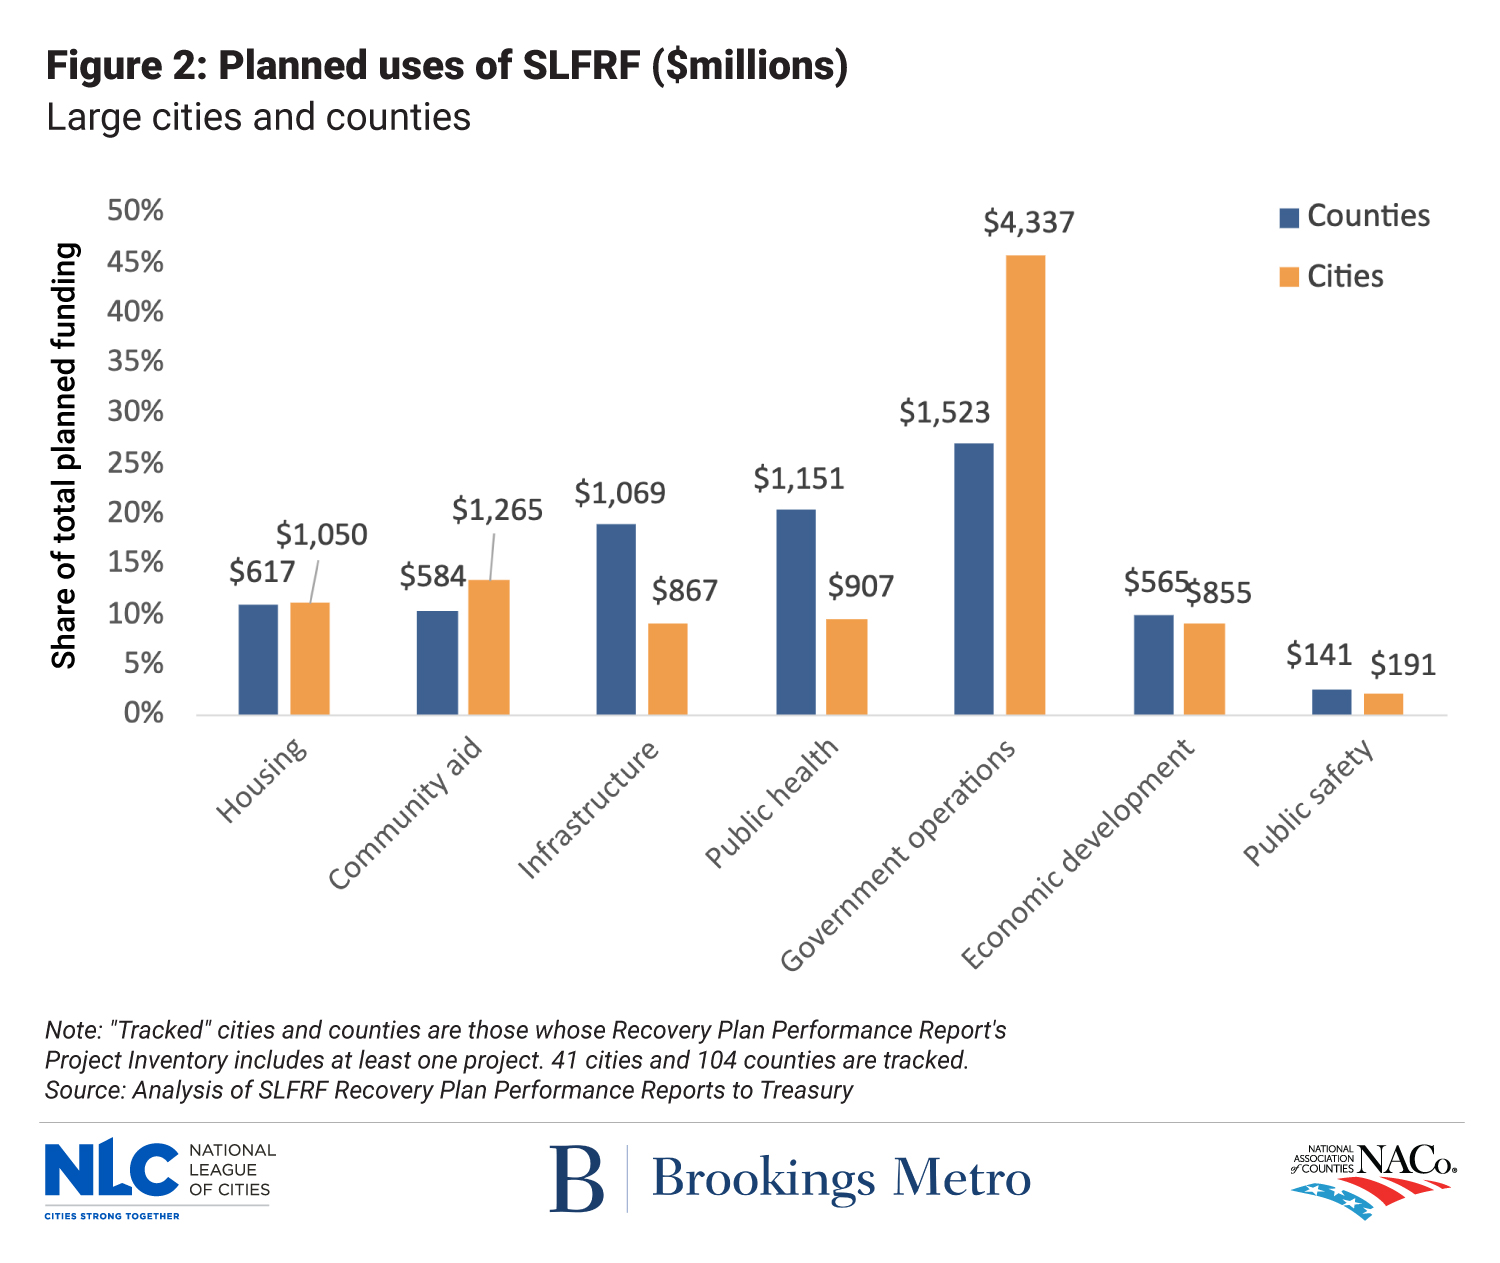
Within the government operations category, large cities and counties are deploying the largest share of their funds toward replacing revenues they were expecting but that were reduced or eliminated because of the pandemic. So far, cities have classified more of their funds for revenue replacement ($4.5 billion) than counties ($1.4 billion). This eligible use provides broad latitude to governments to use funds to provide government services affected by revenue reductions. Some governments, such as Long Beach, Calif., Philadelphia, San Francisco, and San Diego, have decided to use their full SLFRF allocation for revenue replacement. For communities such as Philadelphia, where budgets were hit hard and subject to significant cuts during the pandemic, funds are needed to restore basic city services. Cities such as San Diego, meanwhile, are dedicating all of their SLFRF funds to revenue replacement to take advantage of the maximum flexibility it provides to address serious challenges exacerbated by the pandemic, like homelessness.
Project types reflect differing local government functions and economic circumstances
We use data and descriptions from cities’ and counties’ Recovery Performance Plan Reports to look one level deeper at specific uses of SLFRF funds. For example, within the “Community aid” spending group, cities and counties are providing a range of different supports, including nutrition and food assistance, services for youth and families, direct payments to low-income households, aid to veterans, and grants to nonprofit organizations.

Many counties are using their funds to strengthen local health departments and mitigate the impact of the COVID-19 pandemic. Across the country, counties support over 900 hospitals and promote public health through 1,943 local health departments; in total, counties invest around $83 billion in community health and hospitals annually. The COVID-19 pandemic has strained these health departments and resources.
ARPA has made it possible for counties to strengthen their public health response and address urgent needs of residents throughout the community. In Pierce County, Wash., Council Chair Derek Young stated, “Since the start of the pandemic, Pierce County has prioritized federal and local funds to support emergent public health needs.” The county has allocated more than $10 million in SLFRF allocations toward expenditures such as COVID-19 mobile and mass testing sites, services for COVID-19 isolation and quarantine, and stockpiling and distribution of personal protective equipment.
Many cities are using the funds to augment services and supports for young people negatively impacted by the pandemic. The city of St. Louis, for example, has set aside $2.5 million of its nearly $500 million allocation for a year-round youth jobs program for 300 high-risk, low-income public high school students, building on the success of its STL Youth Jobs summer program. It committed another $1 million to its Department of Health to create safe spaces, drop-in centers, and community projects for young people.
Documenting ongoing implementation with the Local Government ARPA Investment Tracker
In the coming weeks and months, we will learn even more about how large cities and counties are putting their SLFRF dollars to work. In early January, the Treasury Department published final guidance for the program, which should answer questions some places may still have had about permissible uses of the funds. On January 31, large cities and counties were required to submit the first of their quarterly Project and Expenditure Reports. These reports will detail cities’ and counties’ actual uses of the SLFRF dollars, and we will incorporate data from those reports into the Tracker to monitor the size and character of local government spending over time. Lastly, cities, counties, and states are due to receive their second and final round of SLFRF dollars in May 2022, which should accelerate local decisionmaking processes around how to deploy the balance of their allocation. Along the way, we will periodically issue analyses of the latest data in the Tracker, taking special note of innovative, evidence-based, and well-targeted local uses of ARPA dollars.
We hope that a range of users find valuable information in the Tracker. For example, city or county leaders may benefit from seeing which other local governments have committed dollars to a specific priority (e.g., youth workforce development) in which they are also interested. National organizations advocating for localities to undertake particular responses (e.g., premium pay or expanded support for public health) may benefit from tracking their prevalence and impacts over time. And federal officials will undoubtedly pay attention to the rate at which cities and counties are deploying the dollars, and the mix they pursue between near-term recovery efforts and longer-term rebuilding strategies.
With such a significant and flexible pool of resources available to city and county officials around the country—as well as urgent needs the pandemic has created or exposed—many people will be watching local decisions with great interest. The Local Government ARPA Investment Tracker provides a window into a crucial, generational experiment in shared U.S. governance.

Attachments
Related News

In Memoriam: Unfunded mandate reform bill sponsor Dirk Kempthorne
As a freshman senator, Dirk Kempthorne passed a law making it more difficult for Congress to impose the costs of mandates on state and local governments.

Annual ceremony honors unclaimed deceased indigents
Okaloosa County, Fla.'s Lazarus Memorial Service provides a dignified burial for residents whose remains were not claimed by family members or loved ones.

Colorado county and city team up to address local food accessibility
Boulder County, Colo.’s HEAL team collaborated with the City of Boulder’s planning department to build a stronger comprehensive plan department to build a stronger comprehensive plan.