Economic Output and Productivity During the Pandemic: March County Explorer Update
Author

Upcoming Events
Related News

Key Takeaways
Goods and services produced by businesses, nonprofits, governments and other local organizations in counties across the country build national economic stability. Gross domestic product (GDP), often called economic output, measures the total value of these goods and services. The GDP is one reflection of economic health and stability that helps inform local policymakers about the conditions and productivity of our community economies.
HOW HAS RECOVERY FROM THE PANDEMIC IMPACTED COUNTY ECONOMIC OUTPUT?
Percent change in county GDP between 2020 and 2021.
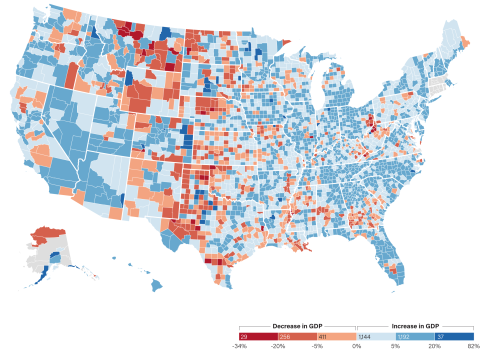
Note: Real GDP in chained dollars.
Source: U.S. Department of Commerce, Bureau of Economic Analysis; Regional Accounts – Gross Domestic Product by County, 2022.
- Aggregate economic output across all counties increased by 5.9 percent between 2020 and 2021, rebounding from the contraction of 2.8 percent between 2019 and 2020.
- Seventy-seven percent of county economies grew in 2021, and 41 percent exceeded national economic growth.
- Over half of counties (51 percent) with decreases in output between 2019 and 2020 have recovered, indicated by exceeding pre-pandemic GDP.
In 2021, many counties that experienced pandemic-induced economic declines began to turn the corner towards recovery. On the national level, the economy more than doubled its growth during the same period, the highest level of growth in at least the past 20 years.
Even as recovery progresses for many communities, local leaders are still confronting the reality of slowed economic activity. Despite the challenges of the pandemic, counties are leveraging evidence-based tools to engage, develop and direct resources that foster economic prosperity.
WHAT WERE THE TOP INDUSTRY CONTRIBUTORS TO COUNTY ECONOMIES?
Percent of counties in which the selected industry was the top-grossing industry in 2021.
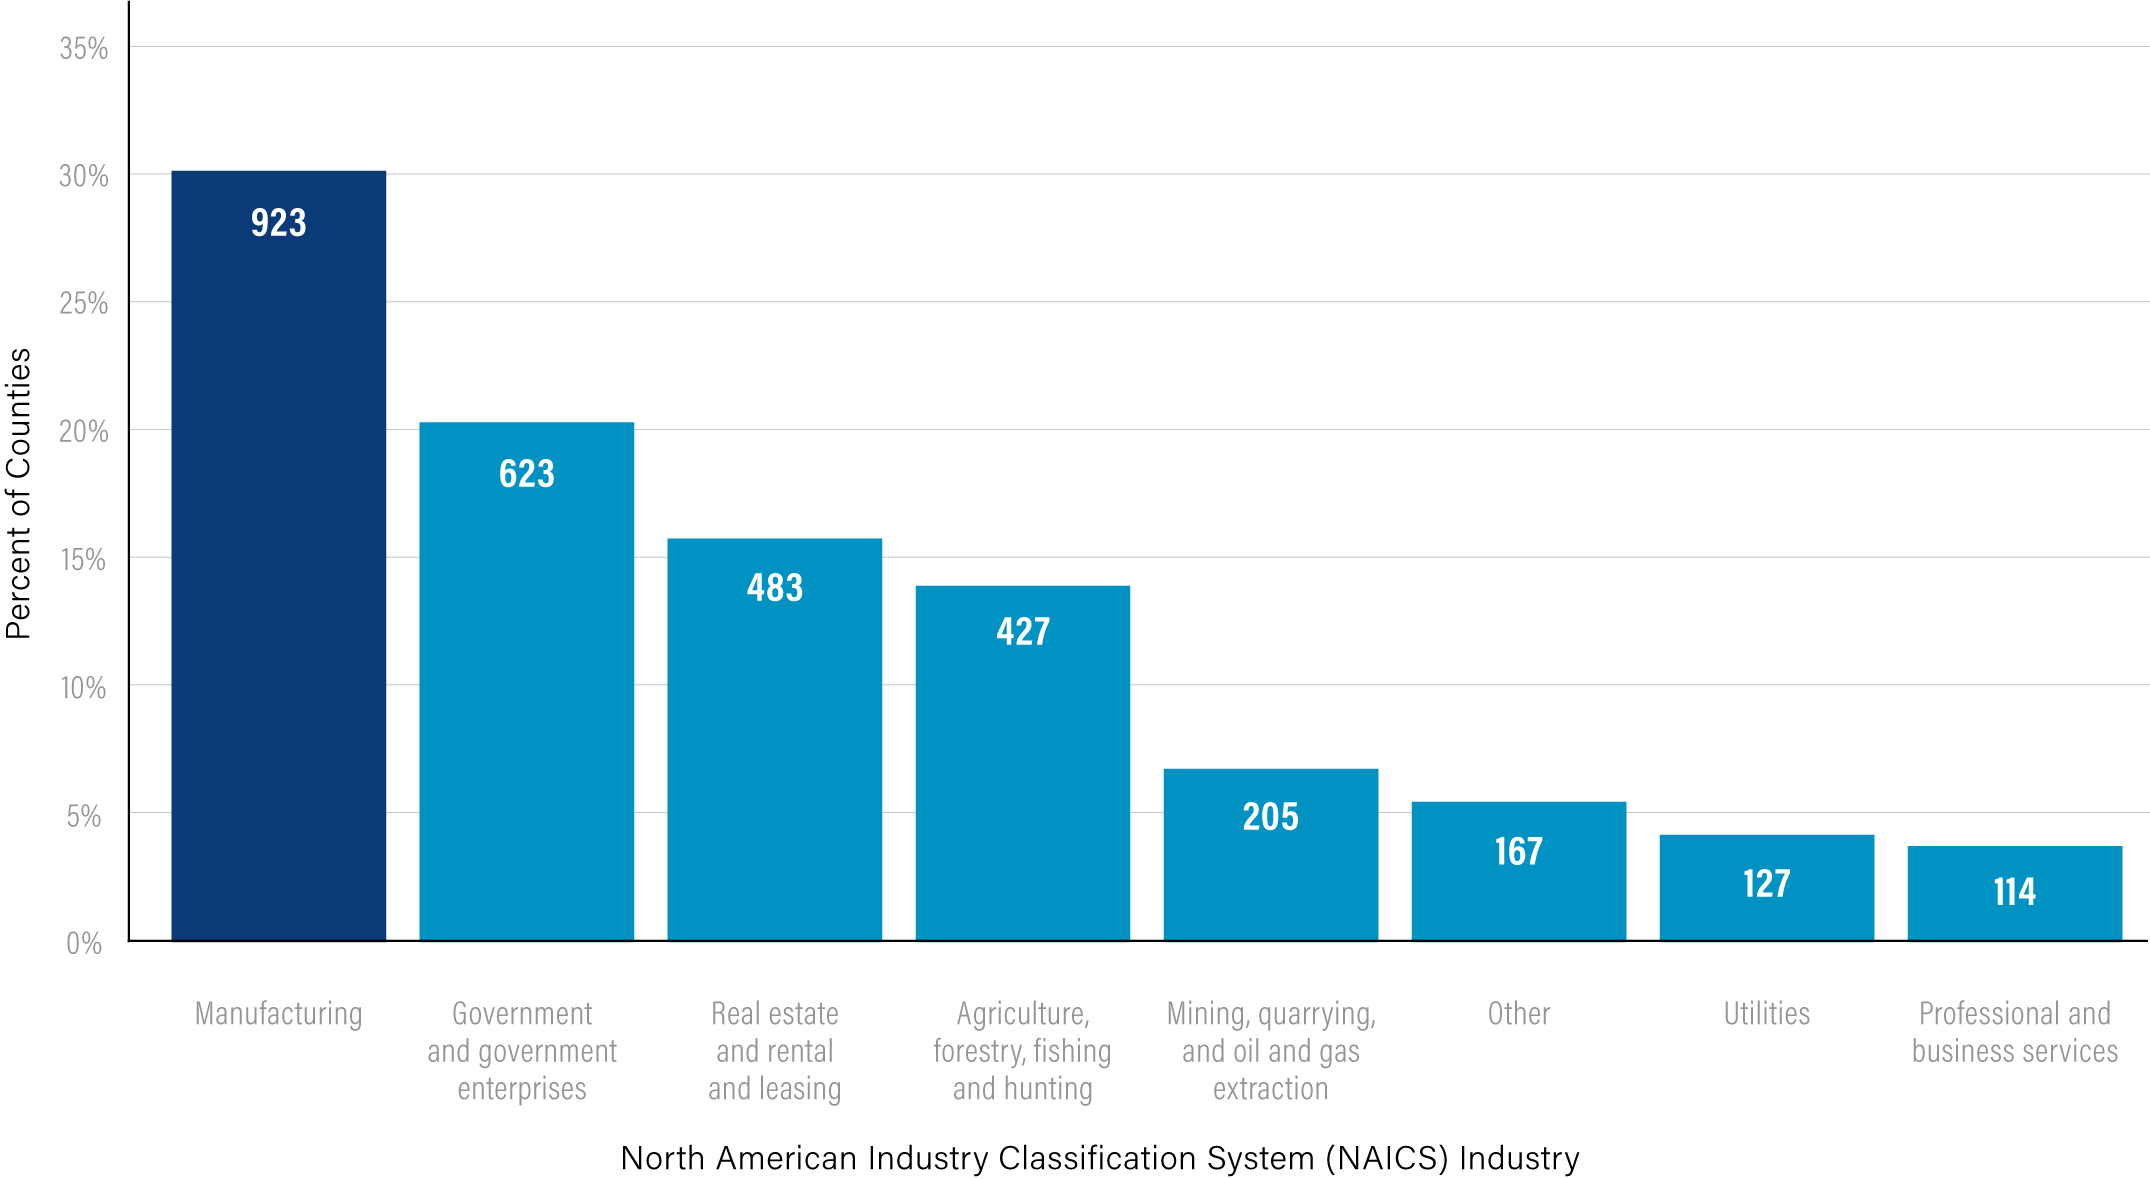
Note: Real GDP in chained dollars.
Source: U.S. Department of Commerce, Bureau of Economic Analysis; Regional Accounts – Gross Domestic Product by County, 2022.
- Total economic output across all counties grossed more than $18.5 trillion in 2021.
- Professional and business services contributed the most to county total economic output in 2021, grossing more than $2.8 trillion.
- Manufacturing is the dominant industry based on annual economic output in nearly one in three counties (30 percent).
Though the United States is often described as a service-sector-driven economy, manufacturing leads the way in many localities – particularly those in the South and Midwest. Counties in the Northeast, by comparison, rely primarily on service-based industries like real estate and rental and leasing, while the top industry for counties in the West is government and government enterprises.
In the initial months of the pandemic, counties with goods and export-based economies fared better; however, as the service sector recovers, economic output from service-based industries will likely continue to grow relative to industries that rely on goods and exports.
HOW DOES COUNTY ECONOMIC OUTPUT COMPARE TO HISTORICAL TRENDS?
Growth in real GDP between 2001 and 2021 by census region.

Note: Real GDP in chained dollars.
Source: U.S. Department of Commerce, Bureau of Economic Analysis; Regional Accounts – Gross Domestic Product by County, 2022.
- Over the past 20 years, economic output across all counties has grown by nearly 50 percent.
- By 2019, 17 percent of counties that experienced declines during the 2008 – 2009 Great Recession had yet to recover; for 40 percent of these counties, the pandemic further exacerbated declines.
- Counties in the Western and Southern regions have sustained the greatest growth over the past 20 years, increasing by 67 percent and 51 percent, respectively.
In recovering from the Great Recession, many counties took over three years to return to baseline, and some have continued to experience the fallout. With resources from the American Rescue Plan's State and Local Fiscal Recovery Fund, county governments are making strides in building the foundation for economic recovery and resiliency not only from the pandemic, but in some cases, from prior economic downturns as well.
DATA SOURCES AND NOTES
Check out NACo’s newest report on GDP here, and find the new GDP numbers and other recent data updates on NACo’s County Explorer tool, available at ce.naco.org.
Source: U.S. Department of Commerce, Bureau of Economic Analysis; Regional Accounts – Gross Domestic Product by County, 2022. Available at www.bea.gov.
Note: All analyses are based on 3,069 counties with active county governments. Thus, Connecticut, Rhode Island and portions of Alaska and Massachusetts are excluded since they do not have active county governments. Independent cities in Virginia are also excluded from the analysis.
Related News

Designation period opens July 1 for new Opportunity Zones
Counties active in the Opportunity Zone process are highlighting census tracts that are ready for work to begin and where local, state and national economic development priorities are aligned.

Embedded developer helps focus county’s economic goals
An Economic Recovery Corps fellow has helped Highland County, Va. work to break out of economic stagnation by adding capacity.
