Managing Disasters at the County Level: A Focus on Technology

Upcoming Events
Related News
Introduction
In order to remain healthy, vibrant, safe and economically competitive, America’s counties must be able to anticipate and adapt to a myriad of changing physical, environmental, social and economic conditions. New and emerging technologies can be particularly critical for counties as they develop plans and programs to increase their resilience to unforeseen shocks. In a world increasingly driven by technology and data-driven decision-making, it is crucial for counties to continually explore data and technology solutions that can help them address local challenges. This exploration includes not only becoming more familiar with new and emerging technologies coming to market but also understanding when and how to introduce these new technologies into county operations.
Some of the most talked about disaster-related resilient technologies of the moment rely on real-time data, mapping and communications platforms. These include geographic information system (GIS), mobile applications, drones, social media, and renewable energies like microgrids. This publication explores how counties across the nation are leveraging data, mapping and application-based technologies to run government services more efficiently, less expensively to build resilience and self-reliance in the face of increasingly severe, frequent and costly disasters.
In 2017 alone, 813 counties received a presidential disaster declaration at least once, and 16 of those disaster events resulted in combined losses exceeding $306 billion. The case studies included within this publication spotlight counties which have taken a proactive approach to improving their understanding of and ability to communicate risk, more effectively manage facilities inspection, and embrace design and building strategies that create more secure communities for their residents. The populations of the featured counties range from 159,000 to 4.2 million residents, and a number of the projects were completed at no material cost to the county beyond staff time.
Big Data versus Open DataBig data refers to voluminous datasets of information that are collected and generated electronically. Open data is government-collected information made available for public use. Open data does not have to be big data, and vice versa. However, when open data principles are applied to big data, counties can begin to craft targeted solutions to local challenges based on what the data demonstrate. As data-driven decision-making becomes more engrained into policy and program development processes, counties are investing in improved big data collection and open data dissemination to provide government services more efficiently, cost-effectively and with greater customization1 ProcurementDue to time-consuming procurement practices, many counties pursuing the use of new technology solutions are finding it useful to use cooperative purchasing, such as the U.S. Communities Government Purchasing Alliance. By using cooperative purchasing, counties are reducing the effort and cost associated with traditional procurement, saving valuable time and money. U.S. Communities’ tech-focused suppliers for green solutions and emergency response, include Ricoh, Insight Public Sector and Graybar, among others. Through the U.S. Communities program, counties can ensure they have the best overall government pricing for solutions that are delivered in a timely manner.2 |
|
Improved Understanding of Risk |

Crowdsourced Mapping
County: Maricopa County, Arizona
Population: 4.2 million
Challenge
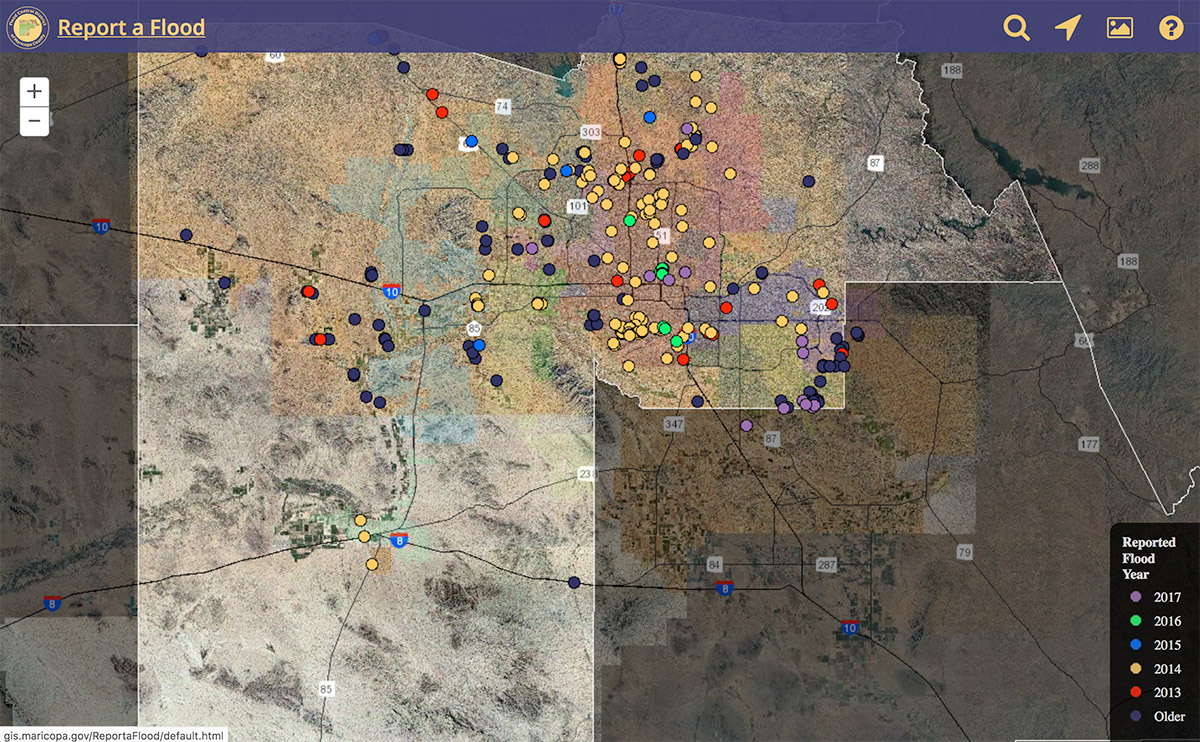
Due to its sheer size – over 9,200 square miles – and the fact that flooding in the desert occurs infrequently and in short duration, Maricopa County had difficulty obtaining photographic evidence of flooding. The photos the county did have were not geo-referenced nor were they stored in one central location, making it time-consuming to locate and identify photos of specific locations when needed.
Solution
Maricopa County created Report a Flood (www.reportaflood.org), a user-friendly web portal that allows individuals to upload and explore geo-referenced, timestamped photos and videos of flooding events within Maricopa County in one central location.
Process
The Report a Flood tool was initially envisioned to collect flooding occurrence data for a singular watershed planning study in northeast Maricopa County. However, the county quickly realized that the platform could be used county-wide and for many other purposes. After conducting some testing, the county’s final version of the tool now includes a landing page that explains its purpose, with a disclaimer and instructions on how to view past and submit new flood incidents. To submit an incident, users click on the map at the location of the flood incident they want to report. They are then prompted to submit the date of the flooding event, the name and contact email of the person submitting and a photo or video attachment. To oversee this type of crowdsourced mapping, county staff review each new report to confirm that it rained on the date claimed – as recorded by area rainwater gages – and if the submission content is appropriate. If a report is deemed inappropriate due to language or the inclusion of personal information, county staff can choose to edit or reject the submission. Each accepted submission appears on the map and is color coded based on the year of the flood incident.
Results
In the arid southwest, flooding problems tend to be “out of sight, out of mind” and are not often thought about by most residents even if they live in an area with higher flood risk. Online resources, such as the Report a Flood tool, help remind residents that flooding risks do exist and, although infrequent, can potentially cause significant damage and loss of life. Additionally, the data, photos and videos collected by Maricopa County have been used to help them justify and convince the public, decision-makers and stakeholders of the need for: floodplain development regulations; flood control structures; stream gages to monitor water levels; and studies to identify flood hazards and capital improvement projects to mitigate flood risk. The Report a Flood tool has helped the county verify that its stream gages are reporting flood flows that reflect the photographic visual evidence, and if they are not, the county has been able to send someone out to recalibrate them. Similarly, the publicly-sourced visual data has helped validate that the county’s flood models are predicting flood flows accurately, and if they are not, the county has been able to adjust the model parameters to reflect the observed flood hazards. Lastly, because the data is public, it can be used by other stakeholders like government agencies, local municipalities and consultant groups without restriction.
Real-Time Damage Assessment Data
County: Racine County, WI
Population: 195,000
Challenge
In July 2017, Racine County was hit by record flooding; the Fox River in Burlington crested three feet higher than the previous record. More than 4,478 properties lost power and a state of emergency was declared.
Solution
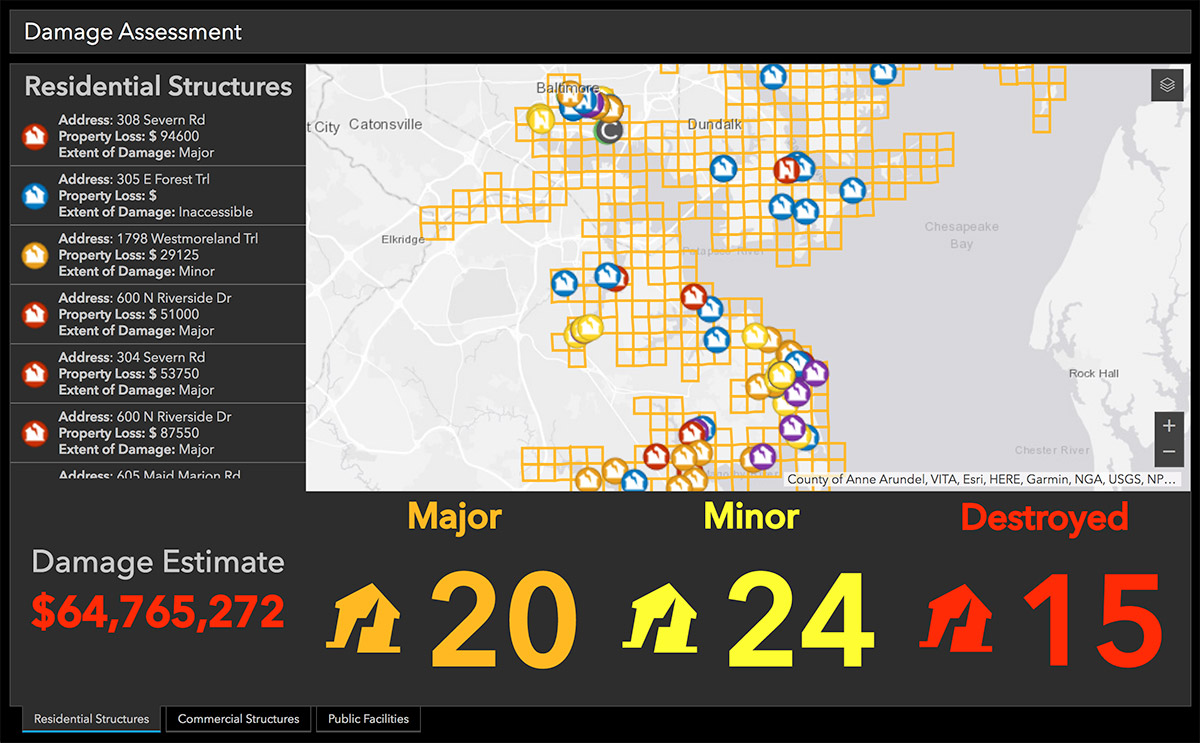
The Esri Disaster Response Program (DRP) was developed to provide complementary support to local governments during a disaster. The Racine County Register of Deeds partnered with DRP to develop and deploy a damage assessment application. This GIS technology helped them spatially record, monitor and update damage assessments and clean-up in real-time using mobile devices, at no cost to the county.
Process
Within hours of the flood hitting, Racine County reached out to DRP for assistance. Sitting down with a DRP team member, the county explained its circumstances and, based on the DRP team member’s experience and advisement, decided to develop a personalized Esri Damage Assessment application and dashboard for their community. This process included creating a map that pulled live NOAA flood level data from NOAA’s Digital Coast platform and geotagged images from residents’ social media posts, as well as developing a set of survey questions for the damage assessors to use as they were in the field. The survey questions were developed with FEMA reporting in mind and were confirmed with the county’s emergency operations center (EOC) before the application was published. In addition to automatic data feeding, the county included a feature that allowed them to manually add in sandbag and water resource areas and damage reports received over the phone. The entire application building process was done in one day, and the application was deployed within three days of the flood event. The county’s Register of Deeds Office, EOC and the Fire Chief worked together to ensure county staff used the app rather than the old paper-based system. They were able to train the team in how to use the application in minutes; a testament to Esri’s easy-to-use design of the platform. As county staff completed the damage assessments, the information and images were shared with the EOC live via the application dashboard. Information was color coded to show which areas with reported damage had been surveyed and which had not yet been surveyed, and how already surveyed properties had been classified on the FEMA scale of affected, minor, major or destroyed. This level of detail allowed the EOC to identify problem areas quickly and deploy teams to those neighborhoods most in need.
Results
Over 900 damage assessments were conducted using the application following the 2017 floods. The application provided an easy way of keeping information organized despite it coming from many different sources and in different formats and large volumes. It saved the county time and staff hours because the data were gathered and entered simultaneously, rather than having to be deciphered and entered later. This improved information gathering process contributed significantly to the county’s ability to efficiently submit information to FEMA and the State of Wisconsin, as the information was collected and organized in alignment with FEMA and the State requirements. Moving forward, the county is in the midst of developing additional surveys and map applications for each of its municipalities, so that when the time comes they will be ready as soon as the EOC is up and running and plans to purchase wifi-enabled tablets that will be ready to use in the event of another disaster.
To learn more about DRP, visit www.esri.com/disaster |
Learn more |
Geocoded Data-Gathering Sensors
County: San Bernardino County, California
Population: 2.1 million
Challenge
San Bernardino County Flood Control District maintained a flood warning system of 169 rain gages (70 of which were self-reporting radio gages using the National Weather Service’s Automated Local Evaluation in Real Time – ALERT – protocol), 38 stream flow gages (14 of which were ALERT), and 10 remote cameras strategically located at areas of particular concern. While most of the data received via ALERT protocol was error free when radio activity was low, as much as 80 percent of data could be lost or corrupted due to radio data collision during a storm event when radio data transmission increased dramatically. Compounding the problem, there was no validity check in the ALERT protocol to automatically delete or correct corrupted data which meant technicians had to manually correct data after the storm event.
Solution
In 2016, the Flood Control District began to improve its overall flood warning system by upgrading 50 ALERT gages, two repeaters and two receiver/decoders with technologically advanced ALERT2 equipment. ALERT2 delivers rainfall and streamflow data at a faster rate and virtually error free.
Process
After learning of a new ALERT2 protocol, the county made the decision to upgrade and customize its existing ALERT gages. ALERT2 radio equipment are solar powered, self-reporting gages that measure rainfall, water level and weather using sensors that transmit data by radio to a base station. By increasing the data rate, adding error detection and corrections, employing Time Division Multiple Access (TDMA), and adding Global Positioning System (GPS) time synchronization, data collection is more reliable and error free. TDMA assigns each ALERT2 station a unique 500 millisecond time slot in a one-minute frame, which allows the system’s 120 gages to transmit data every minute without any chance of data collision. In order to access this data and other weather-related information from one location, the county created a web-based, mobile-friendly interactive map called WETMap. WETMap displays real-time and historic rainfall and streamflow data from the ALERT2 gages, images from the District’s remote cameras, National Weather Service (NWS) watches and warnings, radar rainfall overlays and other relevant real-time and historic data. The data is color-coded by station and available to and used by the public and governmental agencies.
Results
The county can now “see” the movement of a storm through the county so it can alert field personnel to potential areas of concern and make real time decisions about flood fighting, street closures and evacuations when necessary. Since the upgrade to ALERT2, the District has received accurate, error free data from those gages during the rain events. As a result, staff no longer have to spend time revising corrupt data or filling in the gaps of missing data, eliminating the chance of human error in making these revisions and potentially saving $2,100 annually in terms of staff time. The Flood Control District is continuing to upgrade its overall flood warning system. Currently, the District is installing 20 radar gages to monitor accumulated depths in basins and depth of flow in channels. This allows staff to monitor how facilities are functioning and to make time critical decisions during storms. The District will also be upgrading its two ALERT computers, with new software and enhanced user interface. The new software will provide better analysis of storm data, and the enhanced user interface will make the computers and programs more user friendly. Lastly, as the budget allows, the Flood Control District will be expanding its flood warning system into the desert regions of the county, in order to better monitor summer monsoonal storms.
DronesUnmanned aeriel vehicles (UAVs) or drones are a powerful, widely applicable new technology that counties are increasingly using to bolster their planning, emergency management and public safety operations. Drones can be used not just for search and rescue but also for things like damage assessment (capturing aerial imagery pre- and post- disaster), natural landscape monitoring (beach erosion, landslides, etc.) and storm water monitoring for blocked arteries. Due to the GIS applications of the data captured by these drones, the return on investment for counties can be significant. Click here to learn about how Horry County, S.C. is using drones. |
|
Improved Risk Communication |

Interactive, Location Specific Hazards Mapping
County: San Diego County, calif.
Population: 3.3 million
Challenge
Raising citizen preparedness levels for all hazards is a chief priority of the San Diego County’s Office of Emergency Services. The county already had disaster preparedness information organized by hazard and community on its website, ReadySanDiego.org. However, county officials realized they did not have a way for citizens to run custom hazard risk searches by location to identify their individual hazard risks.
Solution
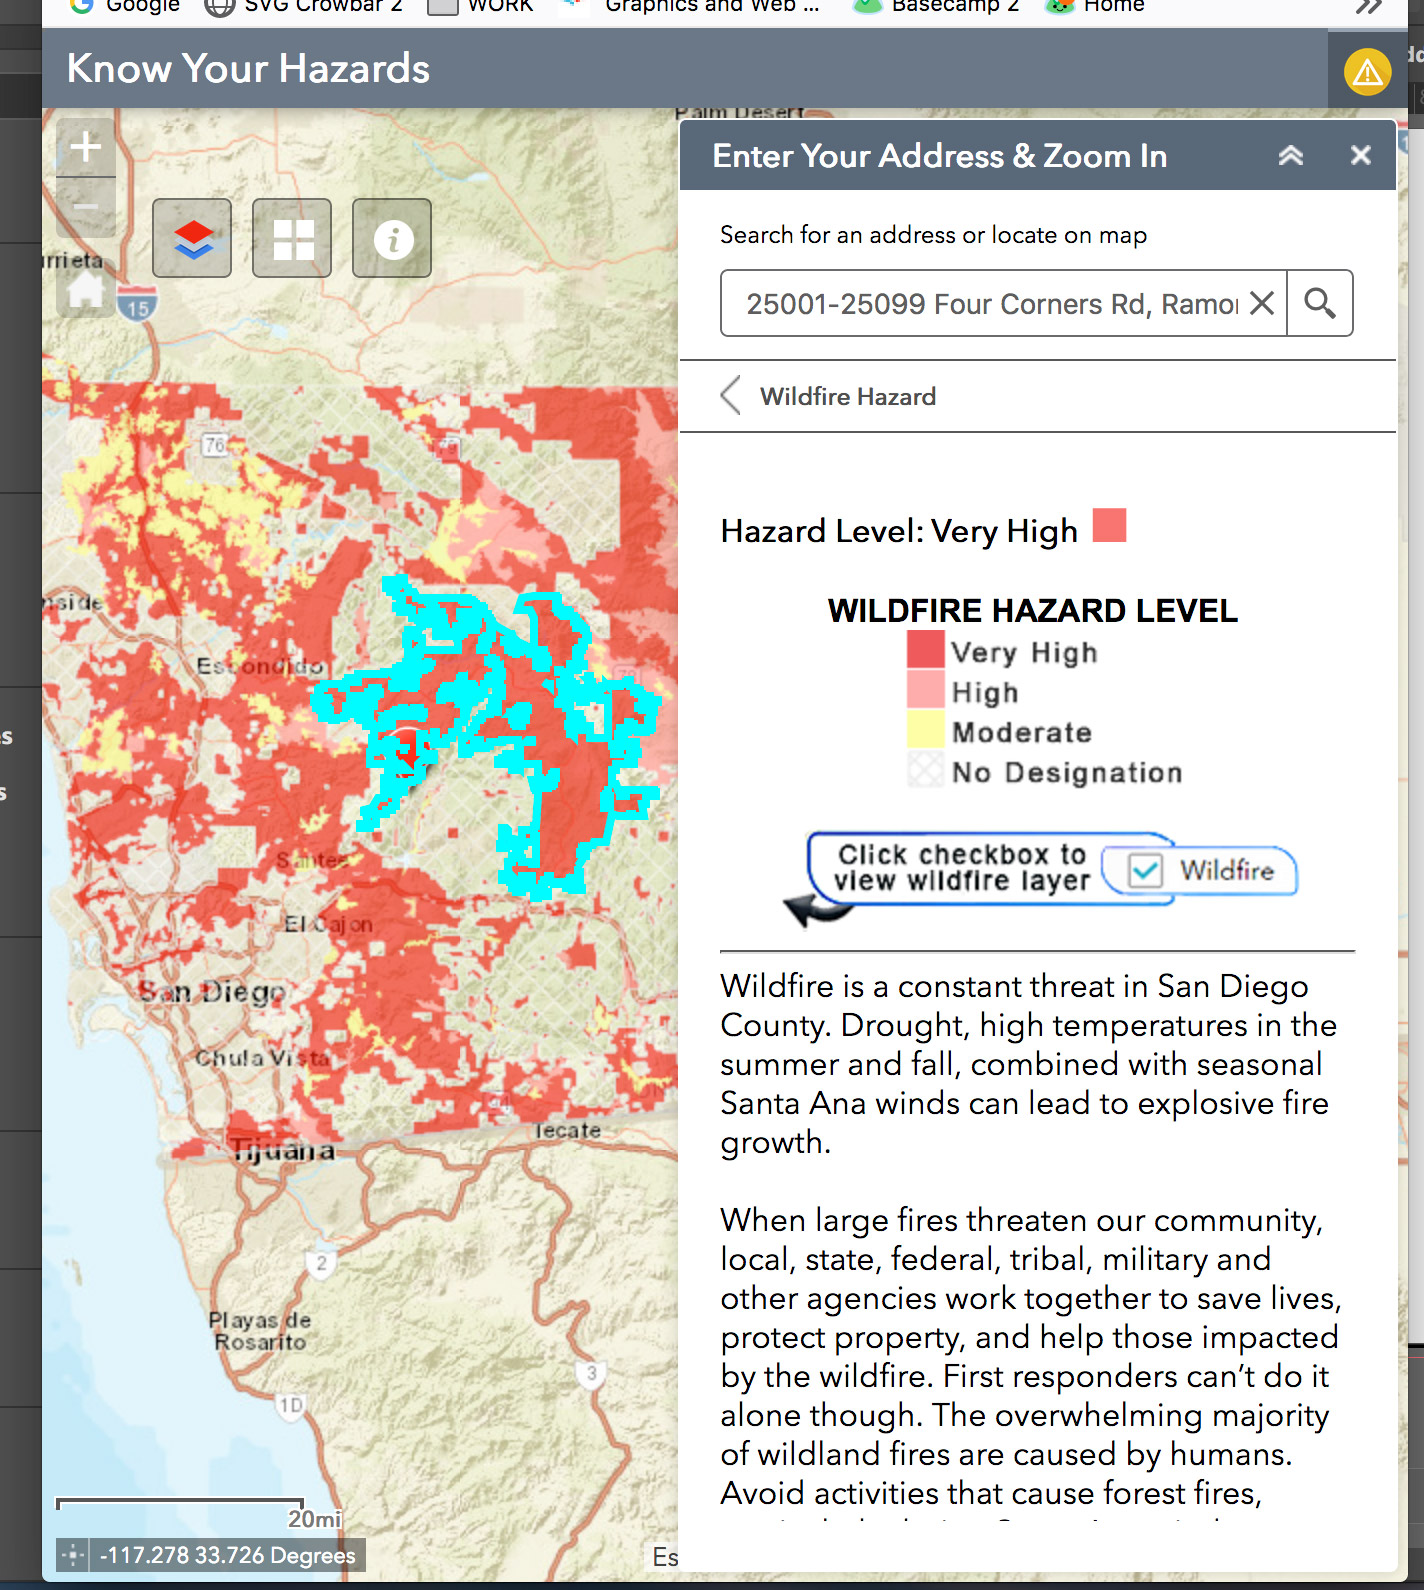
San Diego County developed the Know Your Hazards Map (ReadySanDiego.org/Know-Your-Hazards) to aid county residents and visitors in identifying whether they live or work in tsunami inundation areas, are in proximity to flood zones, are susceptible to wildfires, and if they are in areas of high earthquake shaking potential.
Process
The creation of map took place over a 10-month period. Staff spent time on all phases of the program, including: creating the concept; conducting research; building prototypes; gathering datasets; carrying out development and testing; troubleshooting issues in the ArcGIS Online platform; analyzing and improving performance; creating supporting documents; and building the new web page, among other tasks. Initial research on the Know Your Hazards Map aimed to determine which hazard datasets to include in the tool and who either owned or could serve as an authoritative source on this data. Staff also investigated the capabilities of various “mapping applications” and “widgets” available through ArcGIS Online. After considering all available options, the team chose to use the customizable Esri Web AppBuilder mapping application. Because of the large datasets that needed to be queried for specific address searches, significant performance improvements were required to ensure a seamless user experience. Esri Technical Support assisted in determining the configuration that best displayed address search results consistently across various internet browsers. The tool was also created in Spanish under the name Conozca sus Peligros.
Results
The Know Your Hazards Map helps residents and visitors understand the weather-related risks they face throughout San Diego County and provides a curated, hazard-specific list of preparedness resources from across the ReadySanDiego.org website; all in a single viewer to facilitate disaster preparedness actions. The final user interface is intuitive, does not require training to utilize and is mobile-friendly. The built-in map layers are adjustable and display the full range of different hazard risks at customized locations. The county has increased public awareness and utilization of the mapping tool by sharing the platform through its ReadySanDiego and County of San Diego Facebook and Twitter social media feeds.
San Diego County has created a handy one-pager on how you can build a Know Your Hazards Map for your community |
Learn More |
Emergency Preparedness Mobile Application
County: Volusia County, FL
Population: 517,900
Challenge
Emergency management agencies nationwide struggle to find the most effective ways to communicate the message of preparedness, response and recovery to the public. During emergency situations, almost without fail, most citizens are not prepared to face emerging hazards. When disaster strikes, individuals look for guidance from local government experts, and finding an effective means to communicate this guidance quickly is the goal of all public safety officials.
Solution
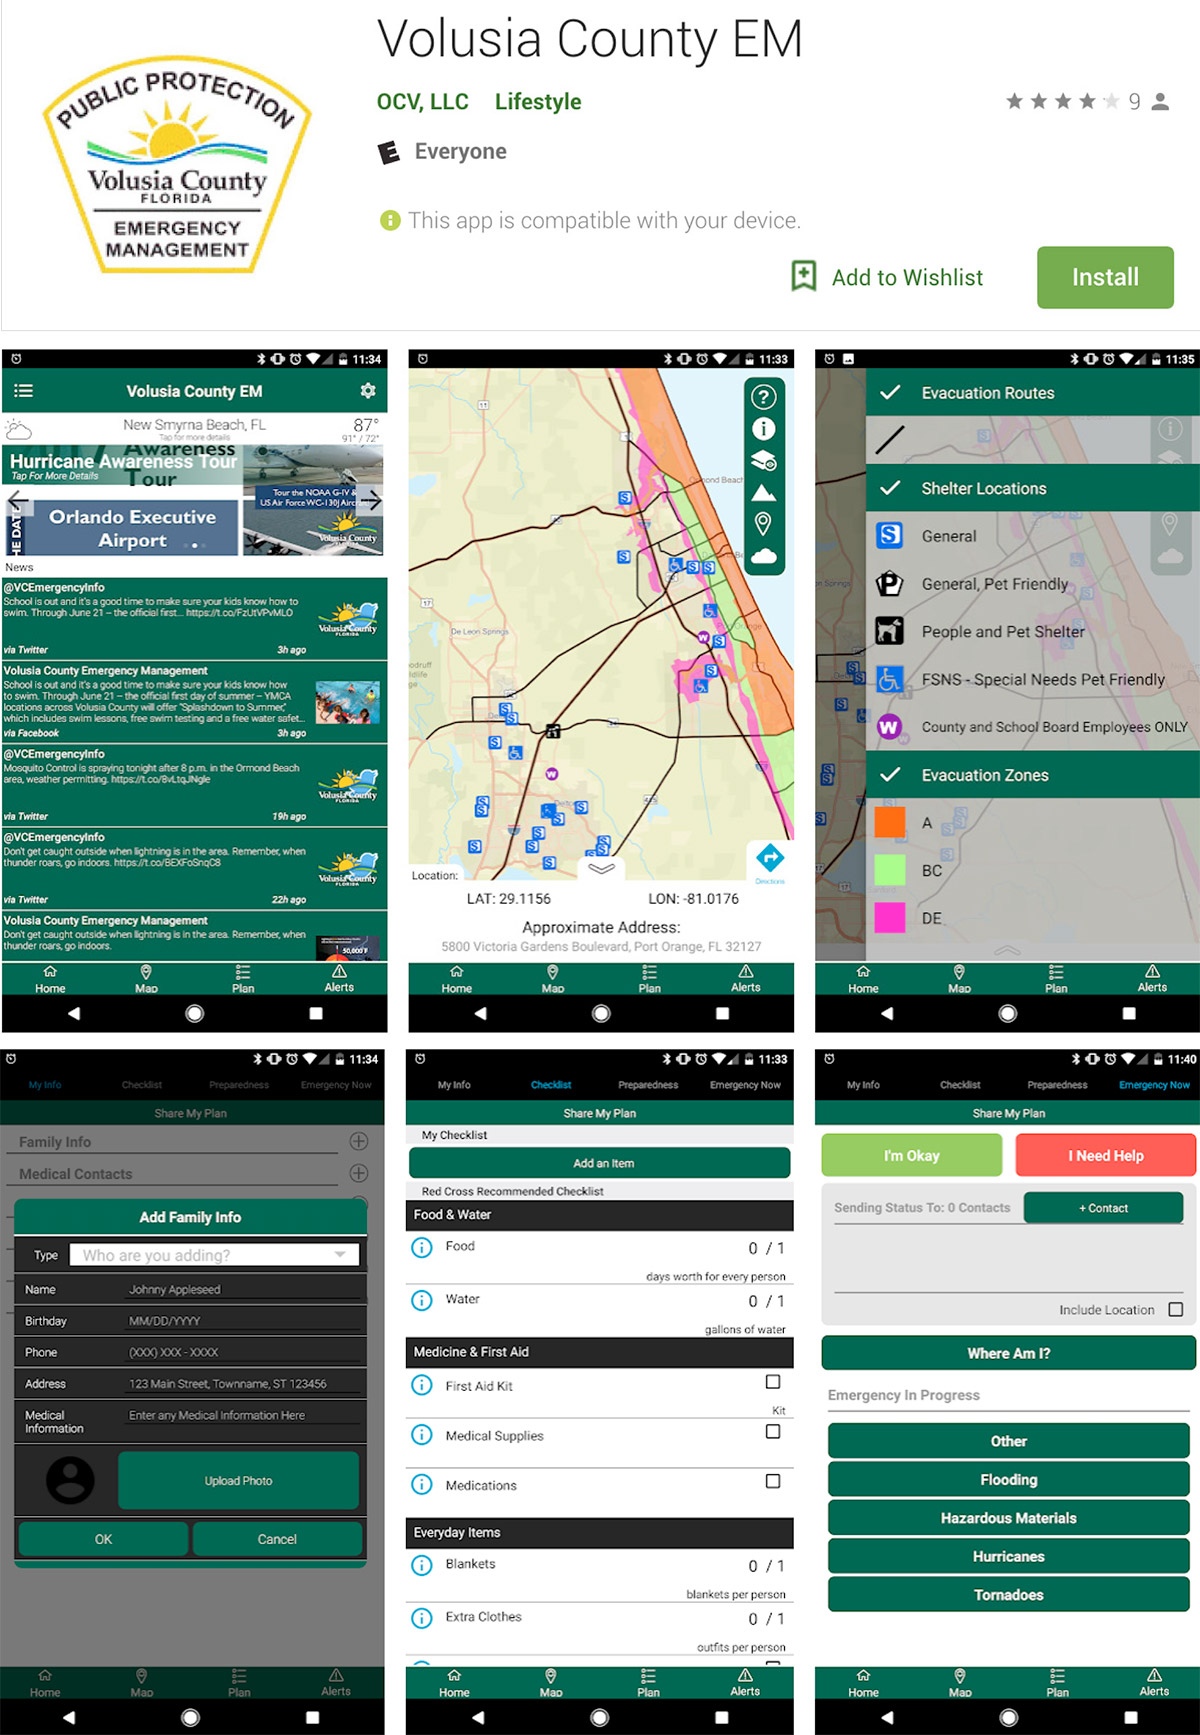
Volusia County decided to create a customized Emergency Management Smartphone Application to serve as a one-stop shop for disaster information, social media posts, emergency shelter locations and damage report collection. The application enhances the community’s understanding of what is happening around them during an emergency and fills a communication gap by delivering timely information to the community and creating an overall method of two-way communication between the county emergency management division and the community.
Process
The smartphone app took approximately 12 months to create. The county first had to decide which features and functions would be necessary to achieve their objectives. They settled on the following features: a home screen that delivers continually updated information pulled from Volusia County’s social media accounts; a map featuring weather radar, storm surge areas, evacuation zones and routes, emergency shelter information (including not only open locations but also remaining capacity at each location) and goods distribution points; push notifications on National Weather Service warnings and alerts, shelter opening information, sandbag dispersal locations, etc.; an area for users to submit damage reports with images and create and update their own shareable individual or family emergency plans, with contact, medical and insurance information; and a section with information on and tips for all hazards, from cybersecurity to tsunamis. Working with a contractor, the Division of Emergency Management, the Public Information Office, several other county departments and community partners built the app to these specifications, creating new, custom features as necessary, and beta tested it with targeted users. Once testing was completed, the County Manager and Volusia County Council approved the app and made it available to the public for download.
Results
Volusia County released the app in June 2017. Since its release, the app has been downloaded over 12,000 times, advancing the county’s communications with its citizens and, in turn, its citizens’ level of preparedness. The county has received outstanding feedback from users who said that the app was a vital tool in the lead up to and aftermath of Hurricanes Irma and Matthew. Following Irma and Matthew, Volusia County residents used the app to submit over 250 damage reports. The county has plans to update the app annually, adding new and revising old features as needed.
3D Visualizations to Enhance Climate Communications
County: Broward County, Florida
Population: 1.9 million
Challenge
Sea level rise and climate change will pose extreme challenges to water management and water supply for most of Broward County, which is dependent on the operation of a finely calibrated and highly complex system of drainage canals, pumps, control structures and stormwater management features. A thorough understanding of these challenges and their economic impacts by community leaders and members is required to ensure appropriate consideration of future climate conditions in planning. Although GIS tools are increasingly used to identify areas vulnerable to sea level rise based on land elevation, these tools are unable to reflect the more complex issues of cascading flood impacts that are assessed with hydrologic models, nor do the two-dimensional analyses lend to an accurate prediction of flood depth.
Solution
Broward County created 3D visualization tools to help more effectively and dynamically communicate the results of its advanced hydrologic modeling of future climate scenarios and their influences on water supplies and flood protection. These visualization tools were intended to increase the interest and urgency of decision-makers and the public to proactively seek and start investing in solutions to impending problems associated with climate change and the influences of sea level rise.
Process
Using tools like Esri’s ArcGIS for Desktop’s 3D Analyst Extension, Adobe Photoshop, USGS MODFLOW and Esri’s CityEngine, Broward County developed 3D graphic visualizations of interactive scenarios for two neighborhoods within the county. Once this visualization was complete, the county convened a local stakeholder team to ensure that they remained cognizant of current community concerns, drivers and needs throughout the process. The team hosted two local stakeholder workshops. The first was targeted to GIS professionals, modelers, and other individuals interested in expanding their skillset to more effectively communicate and present data in a 3D environment. The second workshop was focused to local planners, managers, consultants, engineers, officials and other stakeholders interested in climate resilience planning with an overview of regional climate change influences, modeling and related challenges as well as adaptation strategies emphasizing water and infrastructure management.Results:
Results
Broward County’s investment in 3D visualizations has dramatically enhanced climate communications throughout the region by expanding the audience able to engage in informed conversations about the nature and extent of predicted climate impacts. During and after the technical training, many of the municipalities and consultants expressed their desire to replicate the effort for their areas of interest. The policy-oriented workshop generated strong interest in the continued use of this technique in revealing the very real consequences of inaction by showing the degree of predicted flooding in actual neighborhoods and mitigation of these conditions with various adaptation investments. This framework has facilitated the City of Fort Lauderdale’s recently designated “adaptation action areas.”
Improved formal warning and alerting systemsCounties are increasingly investing in technological platforms that can quickly alert residents to risks. Examples include:
|
Social Media Monitoring
County: Henrico County, Va.
Population: 325,000
Challenge
Social media has become the default platform that the public and government use to share information. Maintaining situational awareness before, during and after a disaster event is one of the most important functions counties must manage, so it is necessary for each county to have at least one person responsible for monitoring social media during a crisis. Henrico County’s Emergency Operations Center had limited staff capacity to monitor social media. But in order to combat misinformation by correcting information quickly across platforms, the county needed to find a way to fill this gap and share data with public safety officials quickly and accurately.
Solution
In 2015, Henrico County established a Virtual Operations Support Team (VOST). VOSTs are teams of everyday citizens who assist in monitoring real-time social media platforms to provide information and resources to support response and recovery efforts during an incident or event. Using Google Documents, these volunteers share relevant tweets and posts to develop a common operating picture for incident command staff, at no cost to the county.
Process
The Henrico County VOST serves as a virtual neighborhood watch for incident commanders and staff. The program is managed as a part of the county’s Citizen Corps programs. VOST volunteers range from teens to seniors and can help from anywhere with an active internet connection – whether from the Henrico Emergency Operations Center or the comfort of their own living room. They are recruited via word of mouth and outreach to various community groups, including the county’s Community Emergency Response Team (CERT), Medical Reserve Corps and Virginia Commonwealth University students. VOST team members undergo the same application process, background check and training as other emergency management program volunteers. In addition to completing basic National Incident Management System awareness and basic Incident Command System training, VOST members receive specialized training in social media basics and on how to use Google Docs to share information. When activated, VOST members work four-hour shifts, led by the VOST Coordinator. The coordinator is also a volunteer and is trained to vet information submitted by the VOST team. At the beginning of an incident, a list of hashtags and other tags are developed. This can range from an incident name (i.e. #2015UCI) to trending tags seen on a few sites, such as Twitter or Facebook. From there, volunteers can add new hashtags or trends or suggest the removal of terms based on what terms are or are not trending. VOST members also monitor traditional, national news sites to identify trending stories and information that can be used to better coordinate response and recovery efforts, such as identifying areas of the county that have unmet needs or need additional assistance.
Results
Between 2015-2017, Henrico County VOST volunteers were activated for the Fall 2015 NASCAR race event, the 2015 UCI bicycle event, Henrico’s response to the January 2016 Winter Weather event and, most recently, the Spring 2017 NASCAR race event. With a current cadre of 40 volunteers, the team posts valuable information to assist law enforcement and emergency responders with crowd safety, damage assessment efforts and situational awareness monitoring. The Virginia Department of Emergency Management recognizes the expertise of these volunteers and has requested them to assist with state-level responsibilities in response to Hurricane Joaquin and the January 2016 snowstorm. This resource is available to any of the county’s local, regional and state partners as needed. The Henrico County VOST has even been able to work side-by-side with VOSTs from Colorado, Florida and Spain.
|
Improved Facilities to Reduce Risk |

Real-Time Infrastructure Inspection Mobile Application
County: San Diego County, California
Population: 3.3 million
Challenge
To meet federal and state environmental protection requirements, counties must monitor the discharge and potential discharge of pollutants into stormwater. This monitoring includes the inspection of local facilities – including commercial businesses and industrial and municipal facilities – to identify sites that are out of compliance. San Diego County’s stormwater compliance inspection process was time consuming. A typical inspection started with research in the office on the computer, followed by inspections in the field using a camera and paper forms, culminating with physically filtering through the paper forms to match them with the right inspection reports and then entering that information into the computer database. This meant that inspectors did not have access to database information in the field, could not prioritize their site visits in real-time and, worst of all, had to duplicate work upon return to the office.
Solution
San Diego County developed an app to enable staff access to the county’s existing enterprise data management system, Accela, from the field to facilitate more efficient, timely and accurate stormwater inspections.
Process
After testing the use of laptops and other readily available application technologies in the field, the county decided to create a personalized smartphone application. The design team chose the smartphone for its small profile, which makes it easy for inspectors to carry, collect and sync data (notes and photographs) with the county’s Accela data management system. During the six-month development phase, the app was tested by county staff on a weekly basis, and updates were made regularly to improve functionality and interoperability with the Accela platform. In the end, many of the inspection processes were simplified and consolidated to allow for an easy-to-see and easy-to-use inspection experience. For example, when a user first logs into the program, previously scheduled inspections automatically appear on the first page; previously, the inspector would have had to query for this information. By using the application’s maps, inspectors can also more easily locate facilities that are due for inspection – they appear as red pins – and can review and update facility inspection data while still in the field.
Results
Inspectors can now use the app while in the field to complete their inspections, attach photographs to the inspection report from the phone’s camera or photo library and submit it directly to Accela and Documentum, the County’s electronic records repository. By streamlining this process, the stormwater inspection program has successfully increased inspection time in the field, reduced inspection data entry time (from 30+ minutes to approximately seven minutes) and improved access to more accurate data in the field, ultimately saving the county on costly staff hours. Another key benefit has been the enhancement of customer service since inspection reports can now be delivered to facility operators and property owners while the inspector is onsite, allowing them to begin corrective actions immediately. The programming work pioneered for this app is now being used as a template for apps in other county programs, and as the need arises, improvements are made to the app’s functionality.
Building codesStricter building codes are a cost-efficient, effective way for county governments to increase their community’s resilience to natural disasters. By requiring facilities and infrastructure to be built to higher standards and/or retrofitted with better-performing, innovative building materials, counties can protect these structures against damage from future disasters. Better performing materials include: seismic resilient pipes, manual shut off isolation valves for pipelines, wind-resistant windows, wind- and seismic-resistant wood framing and ultra-high-performance concrete. 5,6 MicrogridsMicrogrids allow facilities to run uninterrupted by generating their own power during major power outages using a combination of technologies such as solar panels, combined heat and power generation systems, and batteries. Click here to learn more about microgrids and Montgomery County, Md.’s plans to install microgrids at their Public Safety Headquarters. |
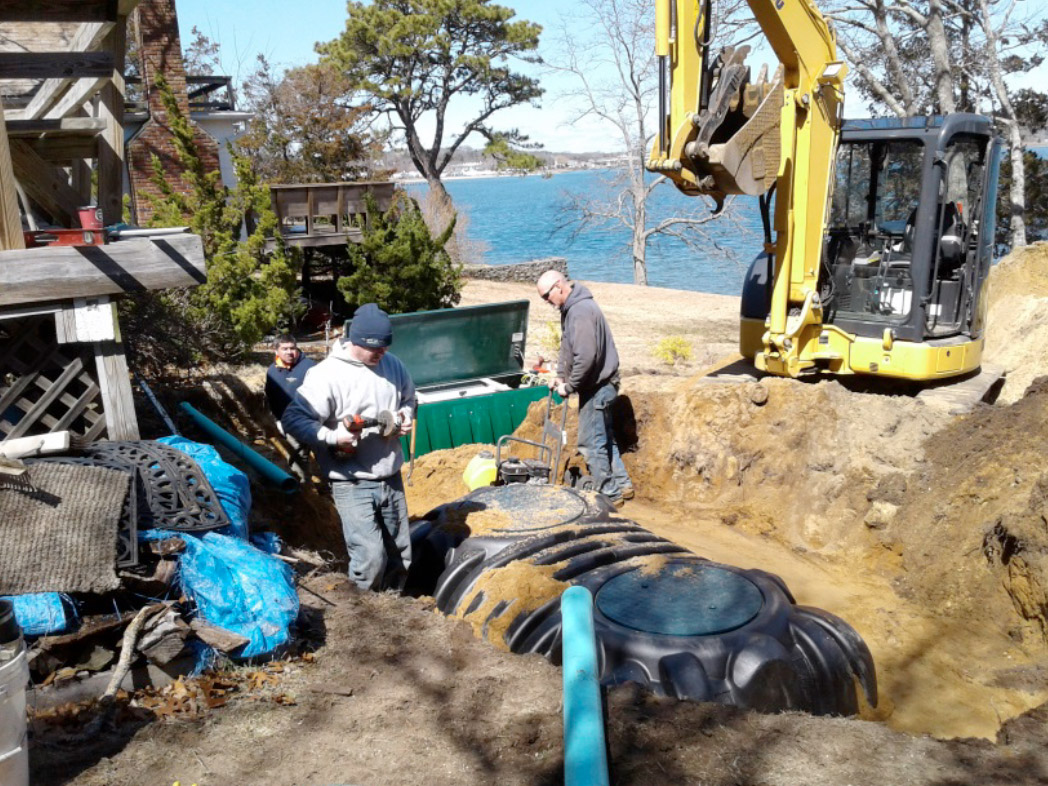
Innovative Alternative Septic Technology
County: Suffolk County, NY
Population: 1.5 million
Challenge
Suffolk County’s drinking water is derived from a sole source aquifer below the ground. At the same time, the county contains the largest number of onsite septic systems in the tri-state (NY-NJ-CT) area, with 74 percent of Suffolk County residences using onsite systems (septic tanks or cesspools) for sewage disposal. Studies have shown that the discharge from these systems is impacting both ground and surface water quality, as impacted groundwater finds its way into local wetlands and marshes – the county’s protective natural buffers from storms. As of 2015, the county’s current Sanitary Code did not allow use of innovative alternative septic technology.
Solution
To address this issue, Suffolk County created the Reclaim Our Water Septic Improvement Program and implemented a multi-pronged program to transition away from the use of antiquated cesspools and septic systems to the use of new innovative alternative onsite wastewater treatment systems (IAOWTS) designed to remove nitrogen from wastewater. In 2016, a county law was enacted to authorize the use of new treatment technologies in the County.
Process
This program began as a demonstration program – which was featured in the July 2014 NACo publication, Planning Resilient Water Systems – to show that the new technologies are effective in reducing nitrogen pollution. During the demonstration program, Suffolk County solicited expressions of interest from manufacturers to donate innovative, alternative onsite wastewater treatment systems for the demonstration program. Through a lottery, 43 single family residences received the new systems free of charge, including installation, monitoring and five years of maintenance. The program has since been expanded to include a grant and loan program that is authorized at $2 million a year for five years. Through the program, eligible homeowners who decide to voluntarily replace their cesspool or septic system with one of the new technologies can apply for a grant of up to $11,000 and also qualify to finance the remaining cost of the systems over 15 years at a low three percent fixed interest rate. The average cost for a system is $19,200.
In additional to creating this new program, Suffolk County has worked to ensure the development of a new industry of qualified professionals capable of installing and providing maintenance for the new IAOWTS technologies. Working cooperatively with the existing liquid waste industry, the County enacted a new law requiring that liquid waste professionals be certified by IAOWTS manufacturers, and immediately began providing training. To date, the county’s training program has graduated over 400 workers as this new industry has grown within the county.
Results
Since its inception on July 1, 2017, the County’s Septic Improvement Program has had 1,248 registrants, 354 completed applications and awarded grant certificates to 243 homeowners. Of those 243, 26 systems have been installed and nine installations are waiting to be scheduled.
|
ConclusionBy taking action to implement technology solutions today, counties are addressing local challenges and increasing their resilience for the long-term. As evident in each case study, counties can access a wealth of information and respond better to unforeseen events if they have upgraded systems in place. It is especially important for county officials to understand the technologies available to them given their responsibility for shaping, setting and funding policies with long-lasting, multigenerational impacts. With public funding across government increasingly strained, local decision-makers must make wise financial decisions and search for new ways to protect their citizens, infrastructure and economies. Investing in technology has become vital to supporting the efficiency and cost-effectiveness of government services. The strategies listed above are not exhaustive but rather provide a glimpse of the breadth of available strategies. By following the lead of these counties, other local governments can increase their own resiliency and divert resources to other mission-critical functions. |

End Notes
- www.naco.org/articles/what%E2%80%99s-big-deal-about-big-data
- www.naco.org/articles/improved-it-procurement-adds-greater-efficiency-improved-bottom-lines
- www.ready.gov/alerts
- www.shakealert.org/
- http://sonoma-county.granicus.com/MetaViewer.php?view_id=&clip_id=750&meta_id=233804
- www.fema.gov/media-library-data/20130726-1707-25045-9020/chapter10.pdf
Acknowledgements
This report was researched and written by Jenna Moran, Program Manager for Resilience, with guidance from Sanah Baig, Program Director for Community Resilience. Special thanks to the following individuals for providing their time and expertise:
- Broward County, Fl.: Samantha Danchuk, Assistant Deputy of the Environmental Planning and Community Resilience Division; Michael Zygnerski, Water Resources Assessment Program Manager
- Henrico County, Va.: Victoria Davis, Public Relations Specialist
- Maricopa County, Arizona: Theresa Pinto, Flood Control District Project Manager
- Racine County, Wisc.: Tyson Fettes, Register of Deeds
- San Bernardino County, Calif.: Kenneth C. Eke, Chief of the Department of Public Works Flood Control Planning/Water Resources Division; Denise Anderson, Executive Secretary for the Department of Public Works
- San Diego County, Calif.: Scott Norris, Watershed Protection Program Coordinator; Rob Barreras, Office of Emergency Services IT Supervisor; Michael Robles, Office of Emergency Services GIS Analyst
- Suffolk County, N.Y.: Peter Scully, Deputy County Executive for Administration in the Suffolk County Executive’s Office
- Volusia County, Fl.: Larry LaHue, Emergency Management Senior Planner