NACo’s County Economies 2016: widespread recovery, slower growth
Upcoming Events
Related News
NACo study shows wage growth slower in most counties in 2016
More than two-thirds of county economies recovered on at least three indicators by 2016, according to County Economies 2016: Widespread Recovery, Slower Growth, a report from NACo’s new Counties Futures Lab that analyzes economic recovery patterns across the 3,069 counties in 2016.
A majority of county economies experienced unemployment rate recovery by 2016, and almost eight in 10 returned to pre-recession economic output (GDP) levels.
The report identifies last year’s growth and recovery patterns by examining annual changes in four indices: jobs, unemployment rate, economic output and median home prices. It also explores average wage dynamics in 2016 and the economic recovery patterns of counties that voted Democratic in 2008 and 2012 presidential election yet switched to Republican in 2016.
County economic conditions can constrain and challenge county governments, residents and businesses or, conversely, provide opportunity. The focus of the report is on the county economy, not the county government. County economies are the building blocks of regional economies (metropolitan areas and micropolitan areas), states and the nation.
Learn More
County Economies 2016 is the first release of the newly created NACo Counties Futures Lab. The lab brings together leading national experts to examine and forecast the trends, innovations and promises of county government with an eye toward positioning America’s county leaders for success. Focusing primarily on pressing county governance and management issues — and grounded in analytics, data and knowledge-sharing — the lab delivers research studies, reports and other actionable intelligence to a variety of venues in collaboration with corporate, academic and philanthropic thought leaders to promote the county government of the future.
More than one in four county economies recovered on all four indicators analyzed, nearly double the rate of the previous year. Most of these county economies are in Kentucky, Iowa, Minnesota, Missouri, Nebraska, South Dakota, Texas and Wisconsin.
Large county economies — in counties with more than 500,000 residents — have the highest rate of full recovery (41 percent). In contrast, more than three-quarters of small county economies, in counties with fewer than 50,000 residents, still did not reach their pre-recession peaks across all four indicators by 2016.
Economic growth was widespread in 2016, but slower than in 2015. While the recovery keeps track of how a county economy is doing after its latest downturn, growth shows how things changed between 2015 and 2016.
An overwhelming majority of county economies saw positive growth across all indicators in 2016, but overall, economic growth occurred at a slower pace than in 2015. Job growth accelerated in only 11 percent of county economies, and home prices increased faster in only 6 percent of county economies in 2016 than in the previous year.
Wages also grew slower in the majority of county economies in 2016. In states such as Alabama, Nebraska and New Mexico, more than three-quarters of county economies saw wages growing at a slower pace in 2016 than in 2015.
Economic recovery patterns at the local level are essential in understanding how Americans feel about the national economy.
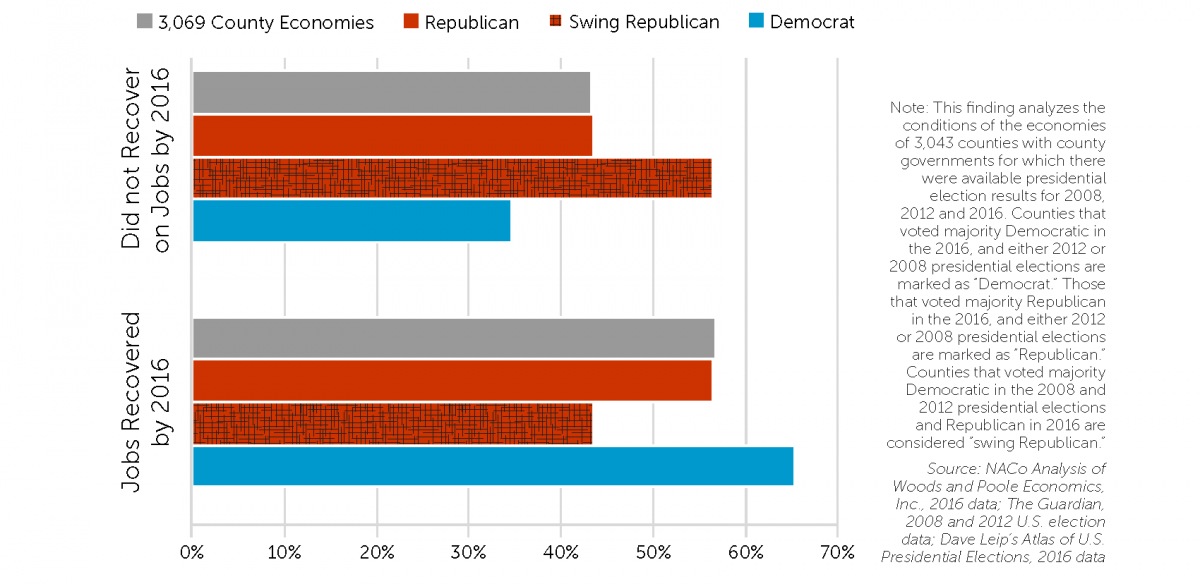
As a presidential election year, 2016 saw about 200 counties that voted for the Democratic presidential candidate in both 2008 and 2012 vote Republican in 2016 (the report refers to these as “swing Republican” counties). The majority are in the Midwest, in Illinois, Iowa, Michigan, Minnesota and Wisconsin. These swing counties are disproportionately mid-sized — with populations between 50,000 and 500,000 residents — and have economies specializing most often in agriculture, forestry and manufacturing.
What differentiates the economic recovery of the swing Republican counties from others is the lower rate of job recovery. The majority of them (56 percent) did not reach their pre-recession job peaks by 2016, while nationally only 43 percent of county economies fit that pattern (see chart).
These swing Republican counties had longer and deeper job recessions than county economies overall. Many of them are counties in which industry left during the recession and has not fully returned.
County Economies 2016 is a reminder that local economic conditions often vary from the national economy’s narrative. The data reveal that the economic recovery accelerated in 2016 on unemployment rates and is taking hold across large swaths of the country.
However, continued economic growth in 2016 most often occurred at a slower pace than in the previous year. Wage growth also slowed last year in a majority of county economies, affecting counties of all sizes.
The opportunities and challenges in county economies across the country show the continued need for a strong local-state-federal partnership in providing economic opportunity.
You can find the analysis, companion interactive maps and individualized county profiles at www.naco.org/countyeconomies. To access them, go to NACo’s County Explorer interactive map www.naco.org/countyexplorer.
Attachments
Related News

White House issues Executive Order addressing barriers to housing construction
White House issues Executive Order addressing barriers to housing construction
National Association of Counties Reinforces Intergovernmental Partnership in Response to State of the Union Address
The National Association of Counties (NACo) responded to President Trump’s State of the Union address with a statement from Executive Director Matthew Chase.

Chamber of commerce program helps keep workers on the job
Audrain County, Mo.'s Workforce Resource Assistance Program has helped employers keep staff in place, reducing turnover and promoting stability.