Payments in Lieu of Taxes Resource Hub

Upcoming Events
Related News
Public lands are national assets – but their costs fall locally. The federal government manages more than 600 million acres, 28% of all U.S. land, including national forests, Bureau of Land Management (BLM) holdings, national parks, wildlife refuges, military installations and more. Approximately 62% of counties have Payment in Lieu of Taxes (PILT)-eligible federal public land within their boundaries, and every acre of federally owned land is an ace that cannot be taxed.
Tagged In:
Jump to Section
PILT 101
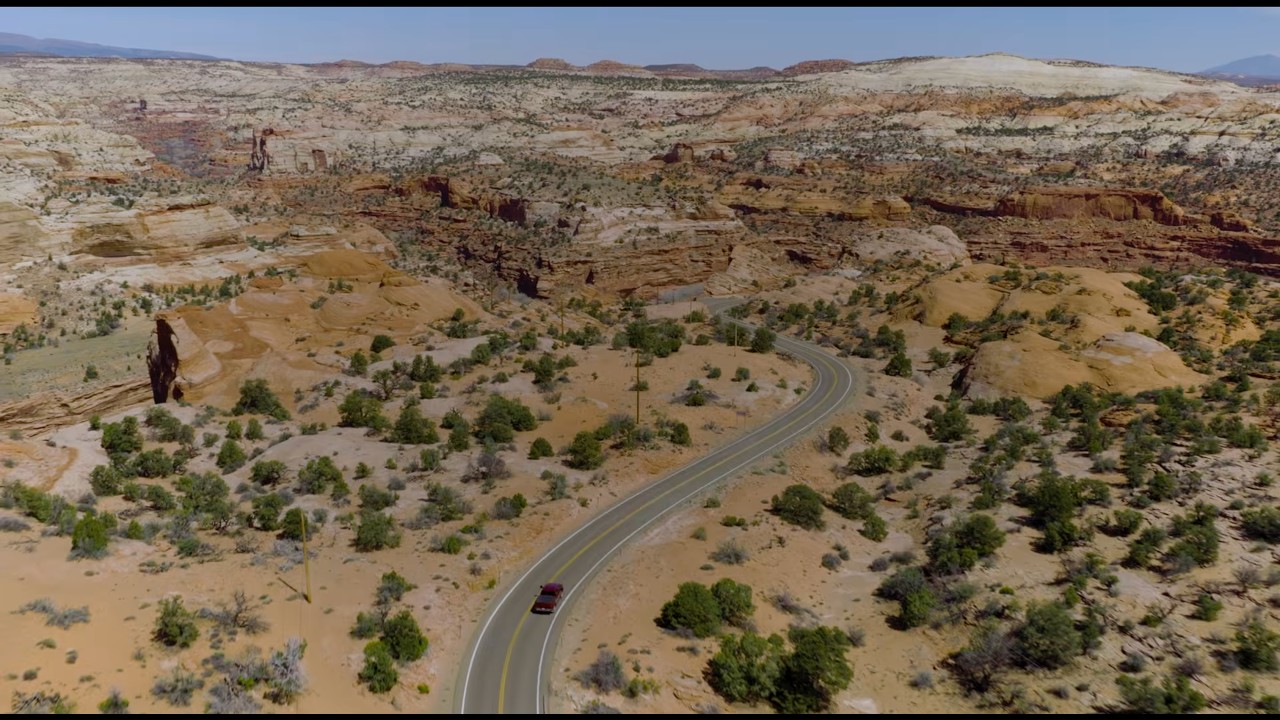
This video from the National Center for Public Lands Counties captures the real experiences of public lands counties from five states and the critical role PILT plays in their fiscal health.
Public lands are national assets, but their costs fall locally. The federal government manages more than 640 million acres, 28% of all U.S. land, including national forests, Bureau of Land Management (BLM) holdings, national parks, wildlife refuges, military installations and more. Approximately 62% of counties have Payments in Lieu of Taxes (PILT)-eligible federal public land within their boundaries, and every acre of federally owned land is an acre that cannot be taxed.
County governments depend on property taxes as their single largest revenue source, accounting for approximately 26% of all county revenue nationally. For public lands counties, that foundation is structurally constrained from the start. Counties that host public lands bear the full cost of the services that make those lands accessible, productive and safe – such as roads and bridges, law enforcement, emergency response and fire protection – without the ability to collect property taxes on the land itself.
The PILT program is Congress's primary response to this gap. Established in 1976, PILT directs annual payments to more than 1,900 counties and local governments based on PILT-eligible federal acreage. In FY 2025, PILT payments totaled $644 million nationally – the largest annual payment in the program’s history. Even so, this represents a fraction of what counties would collect if that land were privately owned and taxable.
Despite the program’s broad reach, PILT has historically been subject to annual appropriations, making payments vulnerable to federal budget pressures. When PILT appropriations fall short of the full statutory calculation, as they have in previous years, counties must absorb the shortfall through service reductions, deferred infrastructure maintenance or adjustments to other budget lines.
PILT by the Numbers
600M
Acres
More than 600 million acres, nearly 27% of all U.S. land, are PILT-eligible
62%
Of counties
Approximately 62% of counties contain PILT-eligible federally owned land within their jurisdictions
$644.8M
Distributed
$644.8 million distributed to counties and other local governments in FY2025
PILT County Profiles
Click your county to download your individualized county PILT profile. Open the fullscreen map in a new window here.
The map illustrates funding received by counties through the Payments in Lieu of Taxes program.
PILT Calculator
Estimate your county's FY2026 PILT payment, and model your FY2027 SRS retention decision.
This is a simulator for informational purposes only, not an official projection. The U.S. Department of the Interior (DOI) sets the final figures. Other factors may affect these estimates, including but not limited to DOI allocations and the accuracy of the data entered.
For questions, please reach out to NCPLC@naco.org.
The PILT formula
A county receives whichever calculation is higher: Alternative A or Alternative B. Enter your county's information below, and the calculator will highlight which alternative applies.
PILT = admin factor × the greater of these two sides:
A-side
min(E·A, P·R(P)) − D
B-side
min(E·B, P·R(P))
Select any term above to see what it means.
More about the formula
You do not need to calculate the deduction ("D") yourself. The calculator determines it using the information you enter.
Get Started
Enter your county's figures and see its estimated payment, worked through step by step.
1Your county
Search your county to fill its figures, or enter them from the DOI PILT report. The estimate updates as you type.
Fills the county's figures from the DOI PILT report, Census Bureau and the Forest Service
Where do I find these figures?
Entitlement acres and population come from Schedule 2 (Section 6902) of the most recent DOI PILT report. The per capita rate for your population is on page 15 of the same report.
Per DOI, populations of 5,000 or more are rounded to the nearest thousand and capped at 50,000; populations under 5,000 use the county's actual population with the 5,000-and-fewer rate.
{{MODELFY}} modeling uses the Census Bureau's Vintage 2025 county population estimates, which the PILT program will use for {{MODELFY}}.
2Money your county already received
Alternative A subtracts the federal revenue sharing your county kept last year. Alternative B, the floor, subtracts nothing.
Where to find this, and optional adjustments
The Department of the Interior posts the prior-year revenue sharing it paid to each state (Enclosure 2) on its Prior-Year Payment Resource Portal. For the exact split of what your county retained versus received, check the Enclosure 3 detail your county certified to the state, which the state then reports to the PILT office.
Most counties leave the fields below at zero. 6904/05: extra PILT for recently acquired federal lands under Sections 6904 and 6905, for example, additions to the National Park System or National Forest Wilderness. Current adjustments: a current-year statutory adjustment that applies to certain counties, varying by state and year. Prior-year adjustments: corrections or true-ups DOI applies from earlier years. Order: greater of A and B, plus current adjustments, plus 6904/05, times the admin factor, then prior-year adjustments.
Model {{MODELFY}}optional
{{MODELFY}} deducts two years of Secure Rural Schools payments at once. Turn this on to model how much of its SRS the county keeps.
This applies an estimated {{CPI}}% {{MODELFY}} inflation step to the rates.
3Rates and factors DOI setsrarely changed
DOI publishes these each year and they are the same for every county. The per-acre rates are on page 3 of the DOI PILT report.
Edit the year's factors
The dashed fields are this year's published values.
Print your county's PILT estimate
Complete the form below to access the printable one-pager analysis of your county's PILT estimate.
Featured Resources

Primer for Counties: Payments in Lieu of Taxes (PILT) and Secure Rural Schools (SRS) Programs
This primer provides public lands counties with foundational information on PILT and SRS, including program history, payment administration, county impacts and key policy considerations.

National Center for Public Lands Counties
The NACo Center for Public Lands Counties advances research, policy and collaboration to help counties with federal lands address unique challenges and strengthen local outcomes.

A Split Story: Economic Trends in Public Lands Counties
This report examines the varied economic trends of public lands counties, highlighting how federal land ownership affects local revenue, service delivery and long-term growth.

Secure Rural Schools Resource Hub
The SRS program delivers critical relief to timber-dependent counties that rely on these funds to maintain essential services, provide quality education and transition toward long-term fiscal stability.
Learn more about PILT
The fiscal burden counties carry is inseparable from the national economic value that public lands generate. County maintained roads provide access corridors that make public lands productive and visitable. County governments absorb service costs that enable an economic return that benefits the entire country, not just the communities bearing those costs.
The scale of that return is significant. On BLM lands, authorized activities in FY2024 generated $245.4 billion in total economic output and supported 884,000 jobs nationwide. On National Park Service lands, 331.9 million visits in 2024 generated $29 billion in visitor spending in gateway communities, supported 340,100 jobs, and produced $56.3 billion in total economic output. The U.S. Forest Service, managing 193 million acres of national forests and grasslands, contributed an additional $40.3 billion in GDP and supported approximately 373,600 jobs, with visitor spending on national forests alone generating an estimated $13.7 billion annually and sustaining roughly 161,000 jobs. Taken together, these three agencies account for hundreds of billions of dollars in annual economic activity that depends, in every case, on the local government services that counties provide.
These benefits flow to every congressional district in the country, including those without a single acre of federal managed land. The energy produced on public lands powers homes in every state. The minerals extracted supply manufacturers nationwide. The recreation opportunities draw visitors from every corner of the country. The distribution of benefits is national; the distribution of costs is local.
Despite the program’s broad reach, PILT has historically been subject to annual appropriations, making payments vulnerable to federal budget pressures. County budgets are built months before the fiscal year begins, revenue projections must be finalized before service levels, staffing and capital commitments can be set. When PILT appropriations fall short of the full statutory calculation, as they have in previous years, counties must absorb the shortfall through service reductions, deferred infrastructure maintenance or adjustments to other budget lines.
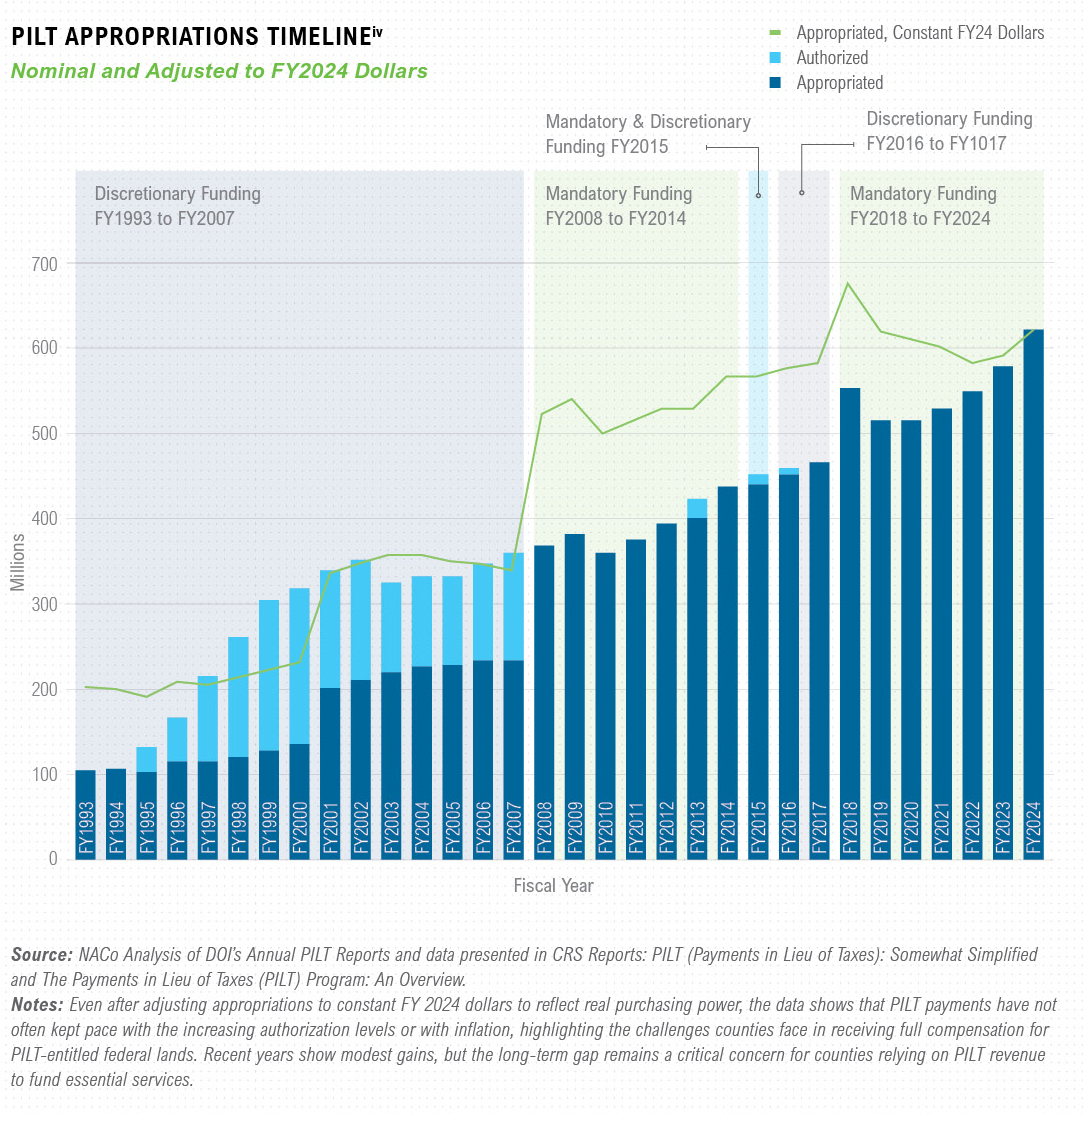
Mandatory spending programs, by contrast, are funded automatically without requiring annual appropriations action. Under a mandatory structure, PILT payments would be determined by the existing acreage-based formula and paid with certainty by giving counties the predictable, stable revenue baseline that responsible local planning requires. The appropriations history below illustrates how payment levels have fluctuated over time, underscoring the fiscal uncertainty that public lands counties face when federal priorities shift.
Not all federally managed land is PILT-eligible. As shown in the graphic below, PILT-eligible land spans nine categories of federal ownership, from national forests and BLM holdings to certain inactive army installations, reflecting the portion of the federal estate that generates no local tax revenue and for which counties may receive compensation.
Nine Categories of Public Lands in the PILT Statute
- Lands in the National Park System (administered by the National Park Service, in Department of the Interior)
- Lands in the National Forest System (administered by the Forest Service, in the Department of Agriculture (USDA))
- Lands administered by the Bureau of Land Management (BLM)
- Lands in the National Wildlife Refuge System (NWRS) that are withdrawn from the public domain (administered by the Fish and Wildlife Service, in DOI)
- Lands dedicated to the use of federal water resources development projects
- Dredge disposal areas under the jurisdiction of the Army Corps of Engineers
- Lands located in the vicinity of Purgatory River Canyon and Piñon Canyon, Colorado, that were acquired after December 31, 1981, to expand the Fort Carson military reservation
- Lands on which are located semi-active or inactive Army installations used for mobilization and for reserve component training
- Certain lands acquired by DOI or the USDA under the Southern Nevada Public Land Management Act (P.L. 105-263)
The payment each county receives is determined by a formula that weighs entitlement acreage against population, with two alternative calculations — A-Side and B-Side — applied and the higher of the two paid out. The formula also accounts for prior-year federal payments, including Secure Rural Schools payments, which are deducted from the A-Side calculation.
Is the county's population greater than 5,000?
Yes
Round population to nearest 1,000, or if greater than 50,000, set equal to 50,000. Multiply rounded population by applicable population payment rate.
No
Multiply population by population payment rate for 5,000.
Section 6902 Payment Formulax
A
Calculate county's eligible acres
B
Calculate ceiling payment based on population
C
Alternative A (A Side)
- Step 1: Multiply entitlement acres calculated in Box A by FY25 $3.46/acre
- Step 2: Compare result from Step 1 with county's ceiling payment calculated in Box B
- Step 3: Select lesser value from Step 2
- Step 4: Subtract prior-year payments from all eligible lands from Step 3 result.
or
Alternative B (B Side)
- Step 1: Multiply entitlement acres calculated in Box A by FY25 $0.50/acre
- Step 2: Compare result from Step 1 with county's ceiling payment calculated in Box B
- Step 3: Select lesser value from Step 2
D
Pick greater of the two alternatives from Box C. This is the county's authorized payment under Section 6902.
E
Sum section 6902 authorized payments calculated in Box D for all counties along with authorized payments under Sections 6904 and 6905. This is the Full Statutory Calculation for PILT.
F
Does funding appropriated for PILT cover the full statutory calculation from Box E?
G
Yes
Pay county full authorized amount.
No
Pay county prorated share of full amount.
Latest from NACo on PILT
Explore the feed below pulling the latest from NACo on PILT, and for more visit the Public Lands topic page.

Public Lands Knowledge Hub
Open to all county leaders, the hub serves as a clearinghouse for resources that advance the policy and practice study for public lands counties. Engage with resources, connect with county leaders from across the country and share updates on the most pressing issues emerging related public lands management, use and access.